
NEWS

Performance Report: Skerryvore Global Emerging Markets All-Cap Equity Fund
The Skerryvore Global Emerging Markets All-Cap Equity Fund returned -0.36% in June. Since inception in August 2021, the fund has returned +3.88% per annum, an outperformance of +3.55% relative to the MSCI Emerging Markets (MMEF) AUD...
Read more...

Performance Report: Quay Global Real Estate Fund (Unhedged)
The Quay Global Real Estate Fund (Unhedged) returned -0.75% in June. Since inception in January 2016, the fund has returned +6.47% per annum, an outperformance of +3.28% relative to the FTSE EPRA/ NAREIT Developed NET TR benchmark which...
Read more...

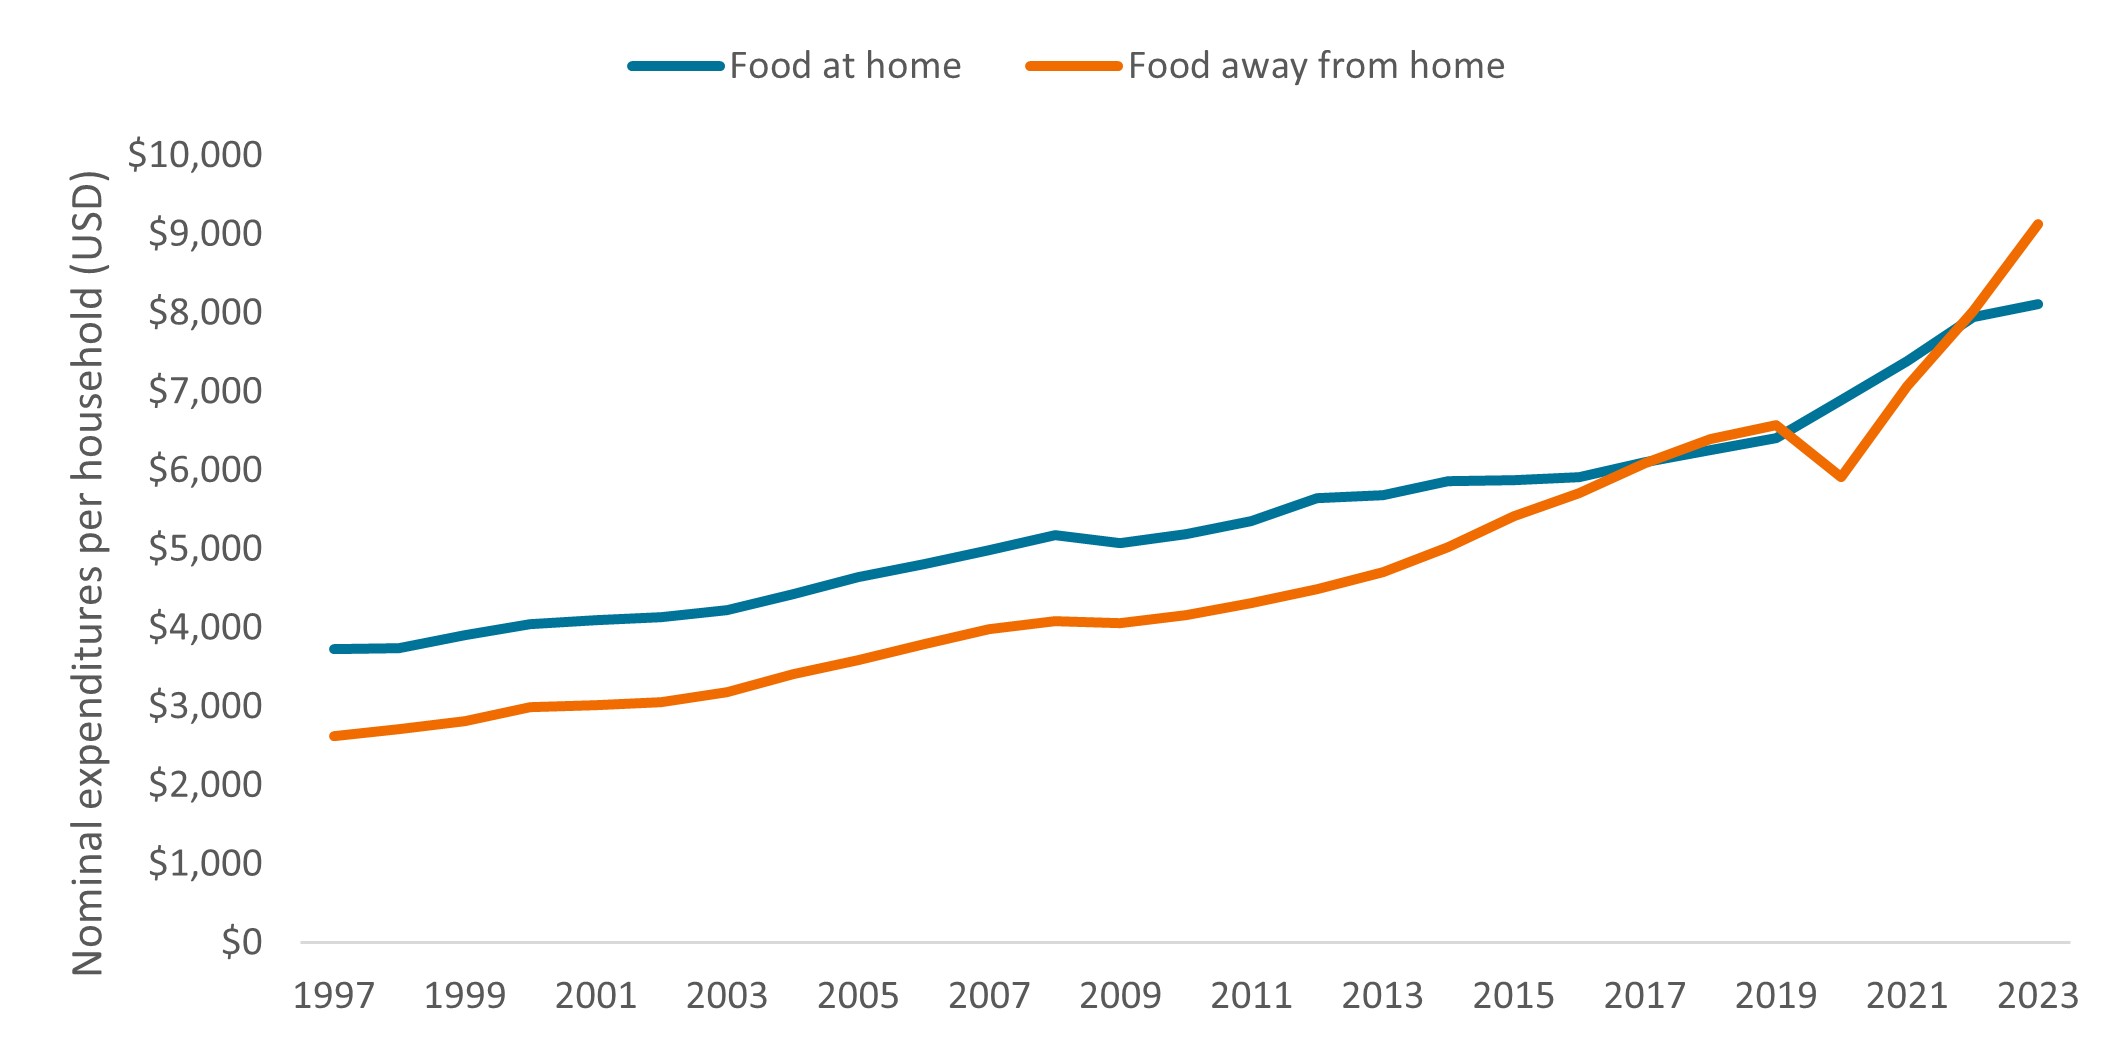
Research in Focus: Fast food companies down, but not out
Portfolio Manager and Research Analyst Joshua Cummings, from the Global Research Team, says that while inflation-weary consumers are pushing back against the price of fast food today, the industry's long-term prospects still appear strong.
Read more...

Performance Report: Bennelong Emerging Companies Fund
The Bennelong Emerging Companies Fund rose by +1.9% in June, outperforming the ASX 200 Total Return benchmark by +0.89%. Since inception in November 2017, the fund has returned +17.67% per annum, an outperformance of +9.3% relative to the...
Read more...

Performance Report: ASCF High Yield Fund
The ASCF High Yield Fund rose by +0.61% in June. Since inception in March 2017, the fund has returned +8.16% per annum, an outperformance of +6.7% relative to the Bloomberg AusBond Composite 0+ Yr benchmark which has returned +1.46% on an...
Read more...

Why Anchoring is Sabotaging Your Stock Market Success
A landscape image representing the stock market and stock market analysis. The background features a digital chart with rising and falling stock prices, candlestick graphs, and financial data overlays.
Read more...

Performance Report: Delft Partners Global High Conviction Strategy
The Delft Partners Global High Conviction Strategy returned -0.81% in June. Since inception in August 2011, the strategy has returned +14.69% per annum, an outperformance of +1.34% relative to the All Countries World (AUD) benchmark which...
Read more...

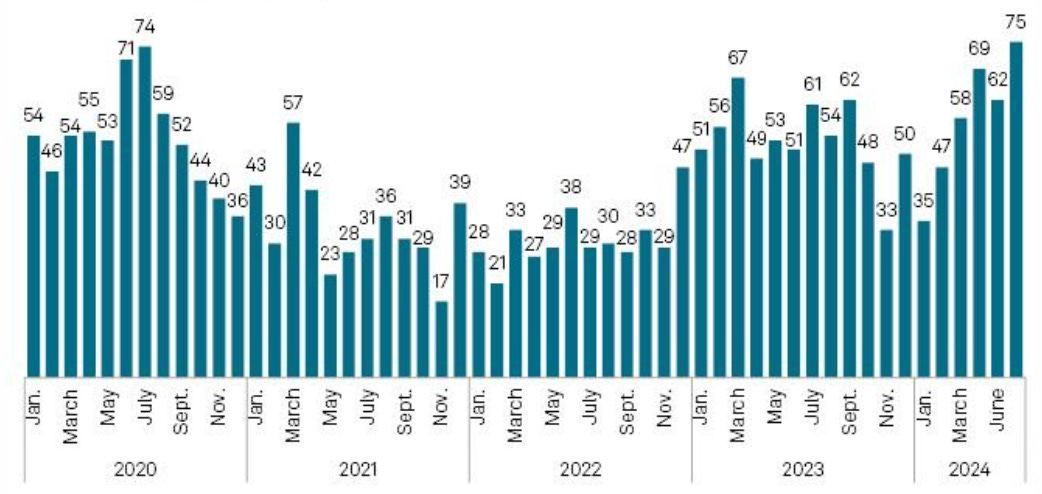
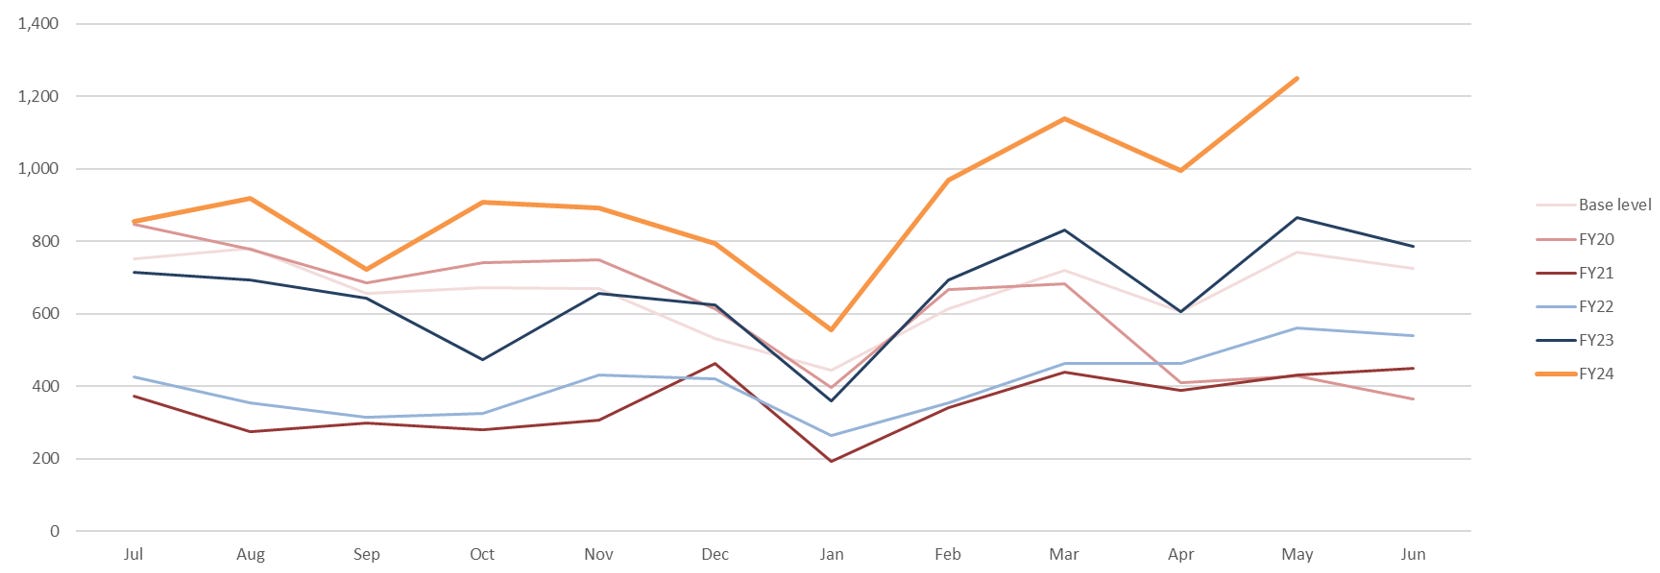
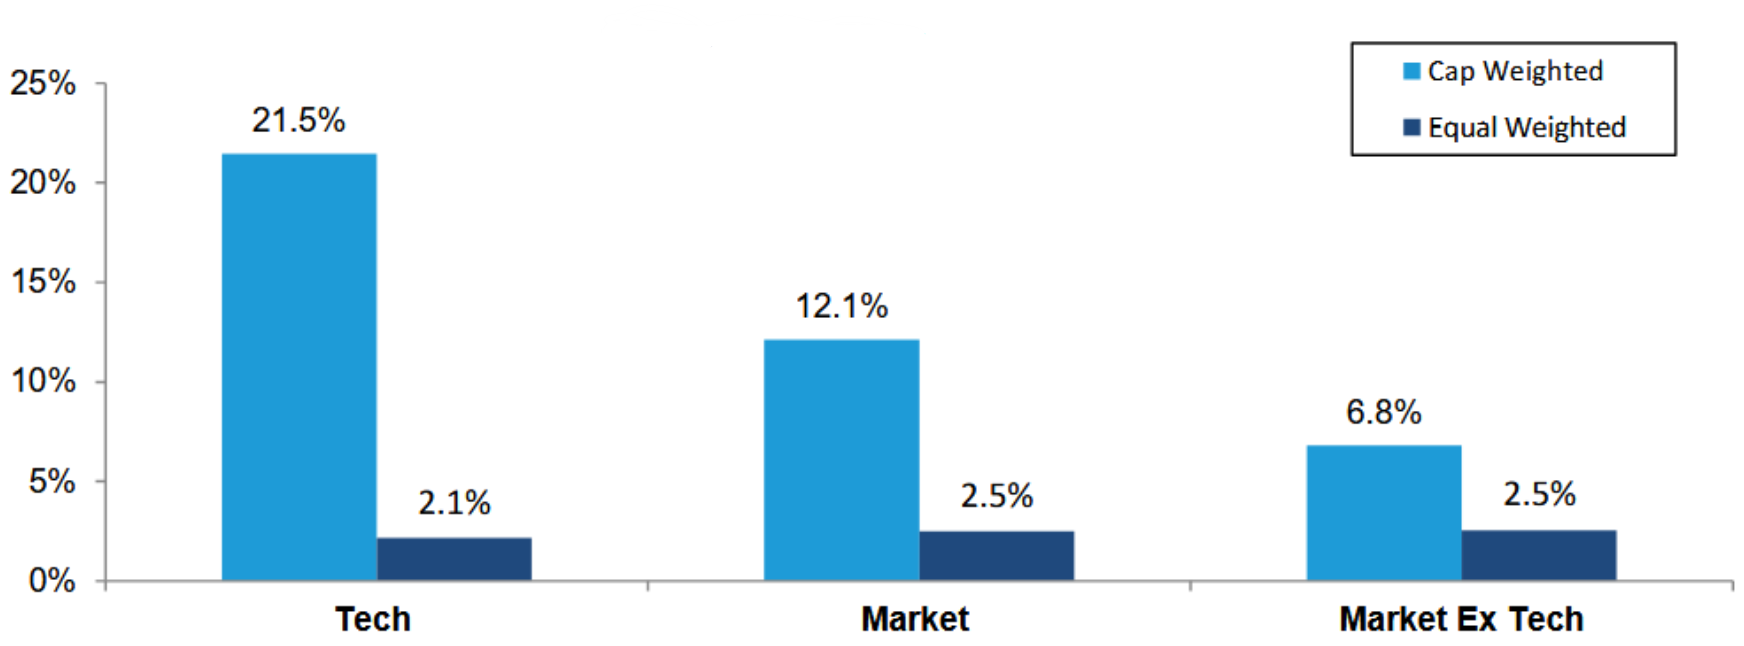
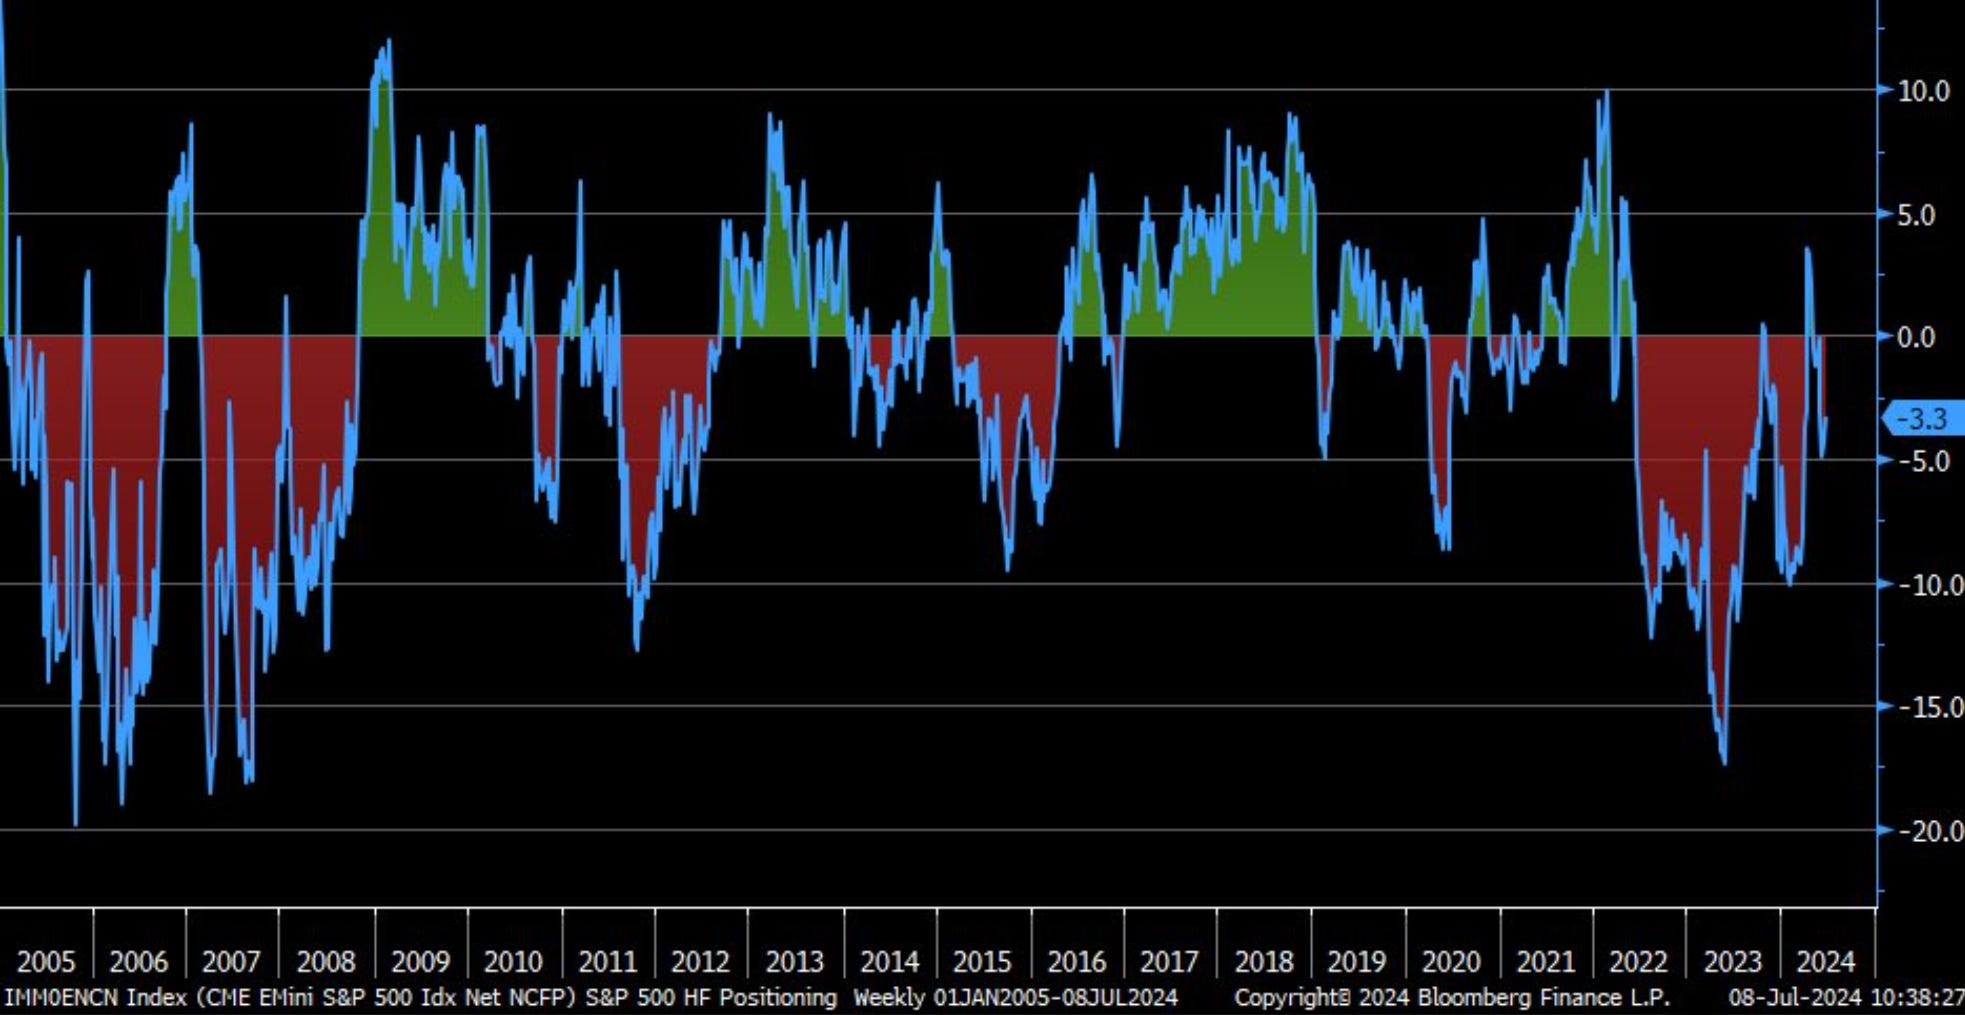
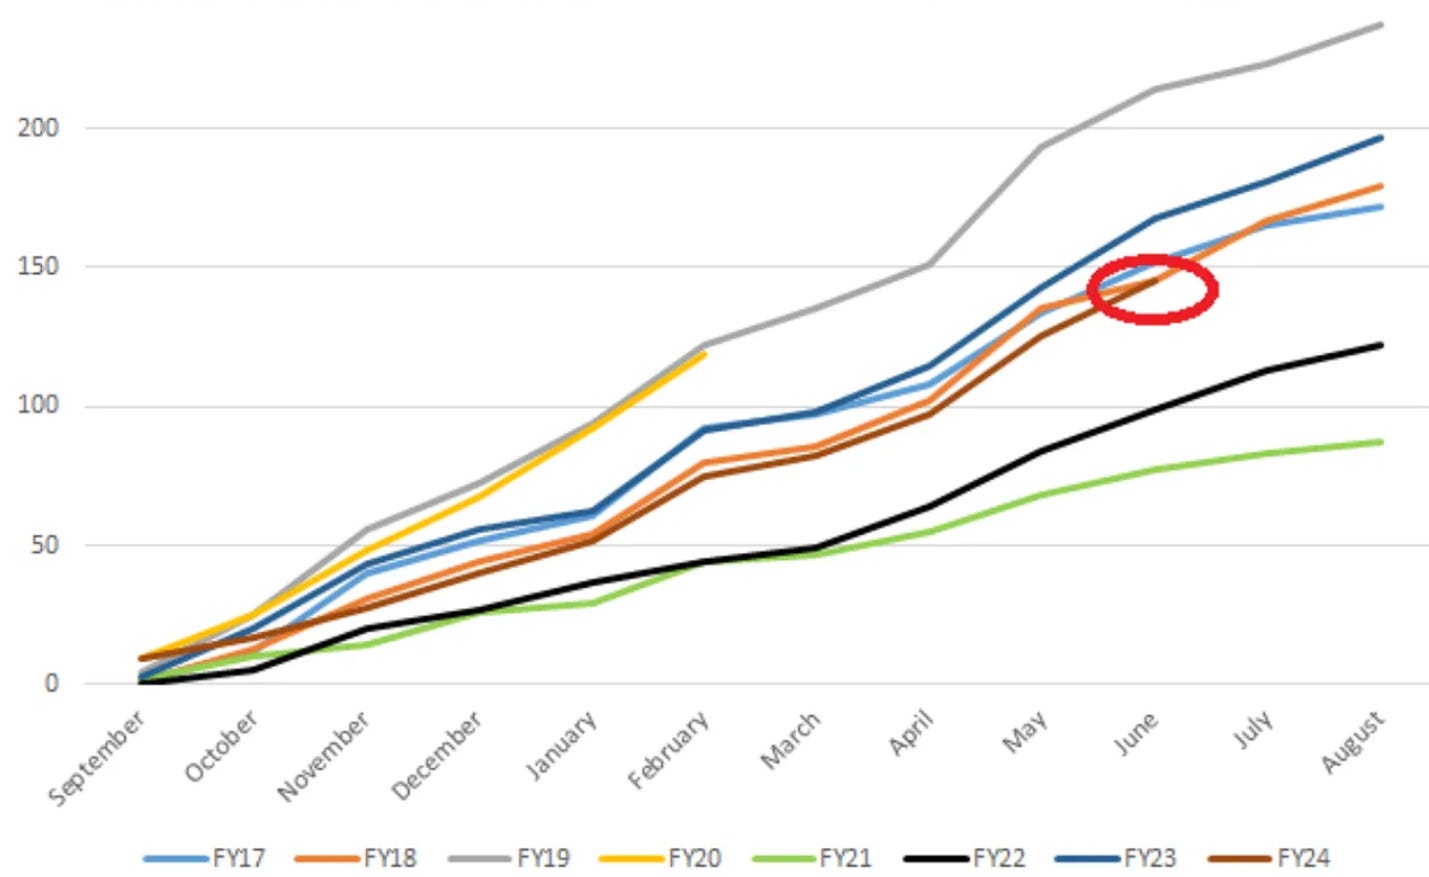
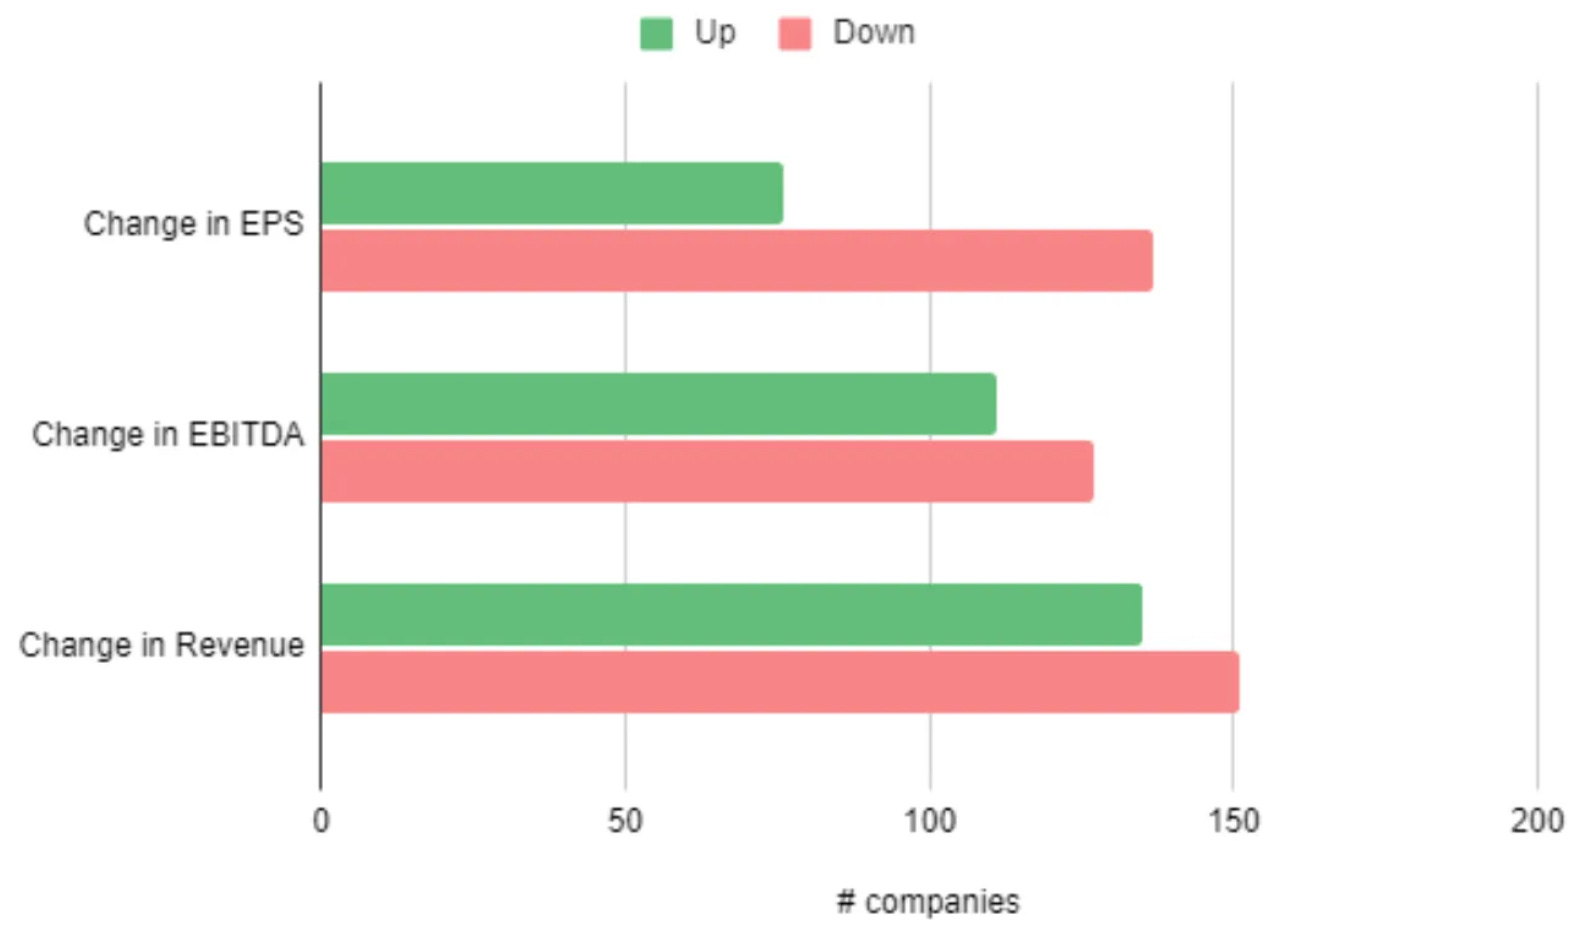
10k Words | July 2024
Seek's national job ads count is down 17% over 12 months; corporate bamkruptcy/administration filings at multi-year highs; equal-weighted tech stocks are lagging cap-weighted tech performance by even more than the broader US market.
Read more...


Hedge Clippings |12 July 2024
If there was one topic aside from inflation and interest rates that was set to dominate the news in 2024, it was going to be elections - or more importantly their outcome. 64 countries, plus the European Union, have held, or are due to...
Read more...

Performance Report: Cyan C3G Fund
The Cyan C3G Fund rose by +4.5% in June, outperforming the ASX Small Ordinaries Total Return benchmark by +5.89%. Performance was driven by strong performances from Schrole and Birddog, while Alcidion and Vinyl were notable detractors....
Read more...