
NEWS

3 Apr 2025 - Trumponomics: What tariffs could mean for small caps
|
Trumponomics: What tariffs could mean for small caps abrdn March 2025 The recent wave of tariffs imposed by President Trump, along with retaliatory measures from affected nations, has created a complex environment for businesses worldwide. While these trade disputes pose risks, they also present unique opportunities for certain US small-cap companies. At the core of Trump's tariff policies is the goal of protecting American industries and reducing trade deficits. Measures that will undoubtedly disrupt global supply chains, drive up the cost of imported goods, and create challenges for businesses reliant on foreign materials. They are expected to, however, incentivize domestic production, potentially benefitting small-cap companies that can step in to replace diminished imports. While not all firms will benefit, we believe companies with resilient business models, pricing power, and strong balance sheets will be best positioned to navigate these economic shifts. Reshoring and supply chain reconsiderationsOne of the primary ways tariffs could benefit small-cap companies is through the reshoring of manufacturing capacity. As tariffs make foreign goods more expensive, many US firms are adapting supply chain strategies to increase domestic sourcing and production. This shift presents new opportunities for smaller companies across a variety of sectors. For instance, reshoring projects will drive demand for local construction crews, concrete suppliers, and equipment rental firms. Regional banks will play a key role in financing these initiatives. Meanwhile, new semiconductor facilities will require specialised HVAC systems with nearby maintenance and repair services. By positioning themselves within these expanding domestic supply chains, small-cap companies stand to benefit from stronger revenue and earnings growth. Tariff-driven innovation and efficiencyAdditionally, tariffs have spurred innovation and efficiency improvements among small-cap companies. Many businesses are investing in automation, advanced manufacturing techniques, and other innovations to offset rising material costs to enhance productivity. These efforts help maintain margins and better position small-cap companies for long-term success. This is especially relevant for technology and industrial companies leveraging innovation to reduce dependence on foreign inputs and strengthen their competitive position. Reshaping the competitive landscapeCounter-tariffs imposed by other nations in response to Trump's policies have also played a role in shaping the competitive landscape. Countries like China have targeted US exports, impacting industries such as agriculture and automotive. While some small-cap exporters face headwinds, others have successfully pivoted to alternative markets. We believe companies that can adapt to shifting trade dynamics and diversify their customer base will be best positioned to thrive. The economic environment remains supportiveWhile we are mindful of the risks associated with recent policy actions, the broader economic environment remains supportive of high-quality small-cap stocks. Despite geopolitical uncertainty, GDP growth is expected to remain in positive territory. Also, many companies have already strengthened operations in response to past disruptions, such as the pandemic and volatility during Trump's first term. These efforts, such as diversifying supply chains and implementing efficiency initiatives, have better-positioned businesses to navigate potential tariffs and raw material inflation. Overall, the US economy is expected to continue expanding, albeit at a more modest pace. This environment allows resilient small-cap companies to capitalise on the new administration's 'America First' agenda while leveraging recent operational enhancements to mitigate near-term risks. ... Along with earnings growthAs we move through 2025, small-cap stocks are gaining attention for several reasons. Investors are increasingly looking to diversify, given the growing concentration of "Big Tech" in large-cap indices. The shift is timely, as small-cap companies are expected to deliver stronger earnings growth relative to their large-cap counterparts (Chart 1). This is an important development as small-cap growth rates have lagged large-caps for several years. Chart 1. Russell 2000 Index (RTY) vs. S&P 500 Index (SPX) positive EPS growth ... And attractive valuationsFurthermore, small-cap stocks are trading at attractive valuations, with their discount to large-caps near historic lows (Chart 2). Chart 2. Small cap relative to large cap forward price/earnings (PE) ratio While multiple factors have contributed to this valuation gap, earnings growth differentials have been key drivers. As small-cap earnings accelerate, this discount should begin to narrow, presenting a compelling opportunity for investors. Final thoughts...Trump's latest tariffs and the retaliatory measures from affected nations are reshaping the competitive landscape for US small-cap companies. While risks remain, the push towards domestic production, supply chain diversification, and innovation can drive earnings growth for many firms over the long term. Coupled with resilient economic conditions and historically attractive valuations, high-quality small-cap stocks present a strong investment opportunity for those looking to capitalise on evolving trade dynamics. |
|
Funds operated by this manager: abrdn Sustainable Asian Opportunities Fund, abrdn Emerging Opportunities Fund, abrdn Global Corporate Bond Fund (Class A), abrdn International Equity Fund, abrdn Multi-Asset Income Fund, abrdn Multi-Asset Real Return Fund, abrdn Sustainable International Equities Fund |

2 Apr 2025 - Making sense of the banking sector
|
Making sense of the banking sector Airlie Funds Management March 2025 |
|
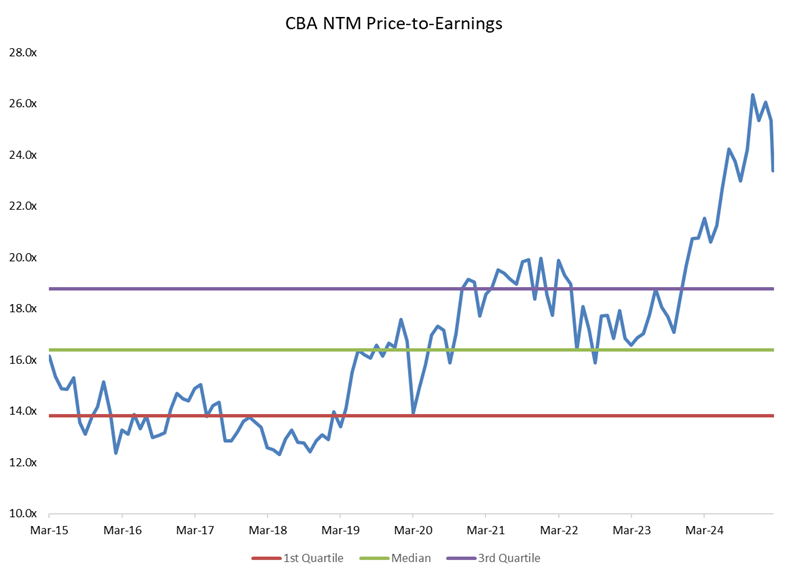
How long will the extraordinary rally continue? The banking sector enjoyed an extraordinary rally in 2024, with the Big Four Banks delivering an average TSR of 33%. As recently as February, Commonwealth Bank (CBA), for instance, enjoyed a price to earnings multiple of 26x- a 60% premium to its historical average. This raises an important question: are these valuations justified for a sector that has not grown its overall earnings per share over the last 10 years?
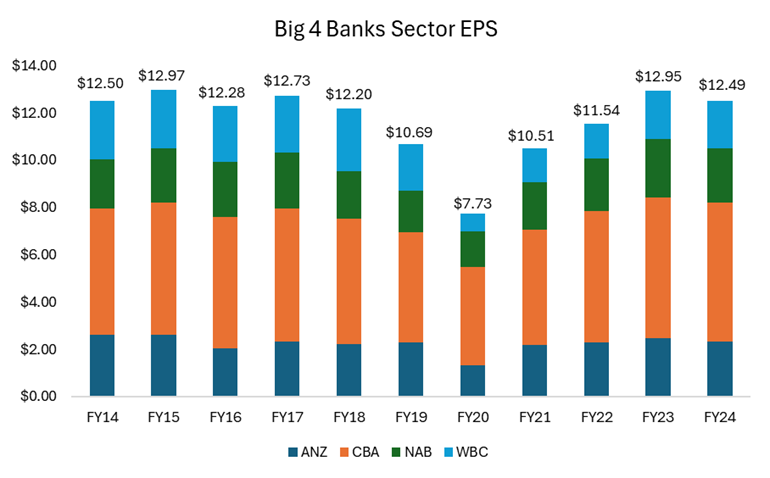
To look at this in another way, you can see in the chart below that the collective earnings of the Big Four are only today back to where they were in 2018. Yet if we add up the cumulative share prices of the banks, you're paying $233 in total for all four banks versus $157 in 2018 for the same level of earnings. And this is after the recent share price rout; at the banks' peak in February, you would have paid a cumulative $276 for these earnings.
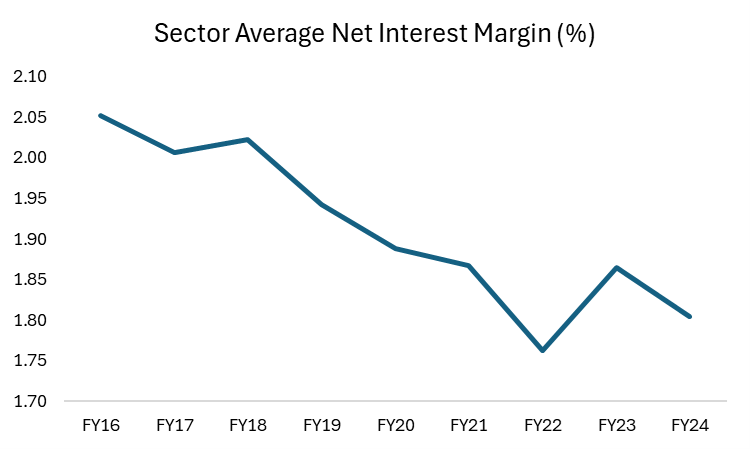
Are banks really making more money? The net interest margin storyAt its core, banking profitability hinges largely on a single key metric: Net Interest Margin (NIM). This is the difference between what a bank earns on loans and what it pays on deposits. The higher the margin, the more profitable the bank. However, over the past few decades, this margin has been steadily shrinking. This decline has been driven by three key structural changes in the industry:
Over the past decade, the share of mortgage broker-originated loans has surged from ~50% to 75%, significantly squeezing bank margins. Banks pay the broker a large upfront commission of ~0.65% of the loan value ($6.5k for every $1m lent) and a trailing commission of 0.15% per year. Moreover, because brokers focus on securing the lowest possible rate for customers, mortgages have become increasingly price-driven, reducing banks' ability to charge more favourable rates. Since brokers earn their largest commission when writing a new loan, they have an incentive to refinance customers regularly, which further erodes bank margins. The Commonwealth Bank estimates that the broker channel is 20-30% less profitable than a loan originated through a bank's proprietary channel.
Over the last decade, Macquarie Group has entered the banking sector, employing a digital, broker-led model where it can operate a lean model without the tech debt and branch costs of its traditional competitors. The company has successfully grown its share to ~5% and its ease of use has made it popular with brokers. Unlike the major banks, Macquarie doesn't need to maintain a constant presence in the mortgage market. It has entered when risk and pricing are attractive and exited when margins tighten, making it a highly agile competitor. This dynamic prevents periods of excess profitability for the Big Four, as Macquarie re-enters the market whenever rates become too favourable for banks.
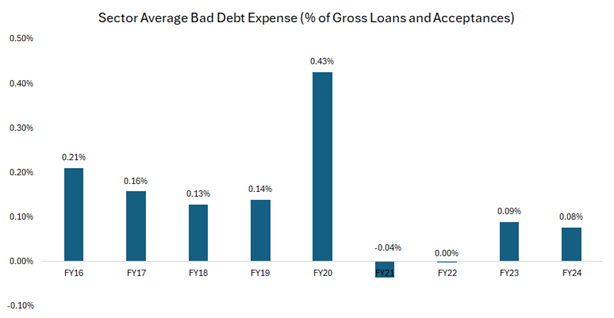
In the past, banks operated in higher-margin businesses such as wealth management and insurance. While these divisions may have distracted them from mortgage competition, they also provided additional profitability. With banks now exiting these areas, mortgage lending has become their primary battleground, intensifying competition and further pressuring margins. Bad debts are low but can this last?One of the biggest risks for any bank is loan defaults, which result in bad debt expenses; that is, the losses banks take when borrowers can't repay their loans. Historically, Australian banks have averaged bad debt expenses of ~0.15% to 0.20% of gross loans and acceptances. In FY24, this figure was just 0.08% - about half the long-term average. While this looks like a positive for bank earnings, the key question is: is this sustainable? Why are bad debts so low right now? There are three key reasons bad debt expenses remain unusually low:
The real risk: Are banks underestimating future loan losses? While bad debts are currently low, history suggests this won't last forever. Since current bank earnings are inflated by unusually low bad debt expenses, it's reasonable to assume:
Bottom line? The current low levels of bad debts make bank earnings look better than they likely are in the long run, suggesting investors should be cautious about assuming today's profits are sustainable. To pick on ANZ as an example - and we chose ANZ because it has the lowest level of provisioning for bad debts - if the bad debts expense were to normalise to ~0.20% of gross loans and acceptances (the pre-covid FY16-19 average) from 0.05% in FY24, its EPS would have been ~13% lower.
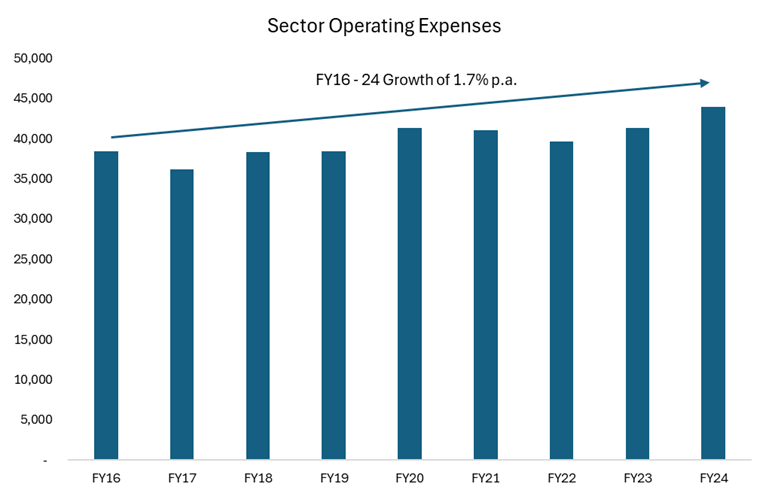
ExpensesOne area where banks could justify a higher valuation is through improved efficiency. However, the track record here is mixed. While banks have closed physical branches and pushed digital banking, these savings have been offset by rising IT spending, cybersecurity costs and regulatory compliance. Additionally, employee expenses account for ~70% of a bank's cost base and wage pressures remain high. The net result? Banking cost bases have proven resilient, making it difficult for them to structurally improve profitability through expense reduction. Since FY16, bank expenses have grown at ~1.7% p.a. compared to income growth of just 0.9% p.a.
This means that despite cost-cutting efforts, banks struggle to convert these savings into higher profits because any efficiency gains are competed away in lower prices for customers. As a result, cost-cutting alone is unlikely to drive meaningful margin expansion at the sector level.
|


1 Apr 2025 - New Funds on Fundmonitors.com
|
New Funds on FundMonitors.com |
|
Below are some of the funds we've recently added to our database. Follow the links to view each fund's profile, where you'll have access to their offer documents, monthly reports, historical returns, performance analytics, rankings, research, platform availability, and news & insights. |
 |
||||||||||||||||||||||
| Ophir Global High Conviction Fund | ||||||||||||||||||||||
|
||||||||||||||||||||||
| View Profile | ||||||||||||||||||||||
 |
||||||||||||||||||||||
| Datt Capital Small Companies Fund | ||||||||||||||||||||||
|
||||||||||||||||||||||
| View Profile | ||||||||||||||||||||||
 |
||||||||||||||||||||||
| Atlas Australian Equity Income Fund | ||||||||||||||||||||||
|
||||||||||||||||||||||
| View Profile | ||||||||||||||||||||||
 |
||||||||||||||||||||||
| Ziller Asset Management Founders Global Fund | ||||||||||||||||||||||
|
||||||||||||||||||||||
| View Profile | ||||||||||||||||||||||
|
Want to see more funds? |
||||||||||||||||||||||
|
Subscribe for full access to these funds and over 900 others |

31 Mar 2025 - Manager Insights | Altor Capital on the Business of Sport
|
Chris Gosselin, CEO of FundMonitors.com, speaks with Benjamin Harrison, Chief Investment Officer at Altor Capital. Ben discussed the growing investment opportunities within the global sports industry, highlighting its diverse revenue streams and Altor's strategic focus on both team ownership and related support sectors. The conversation underscored the potential for meaningful investor involvement beyond just elite-level teams, particularly within Australia's mid-market sports landscape.
Disclaimer This video presentation (the "Content") has been prepared by Australian Fund Monitors Pty Ltd, "AFM" (AFSL 324476) and has been prepared without taking into account the investment objectives of the viewer or recipient. The Content is intended for information purposes only, and recipients should conduct full research and take appropriate advice prior to making any investment decisions. The Content is believed to be accurate at the time of publication, but past performance is not guaranteed. Copyright, Australian Fund Monitors Pty Ltd. October 2024. |

28 Mar 2025 - DeepSeek is much more than the Sputnik Moment
|
DeepSeek is much more than the Sputnik Moment Ox Capital (Fidante Partners) February 2025 The introduction of DeepSeek into the market exemplifies the technological advancements that Chinese companies have achieved in recent years. Through company visits and discussions with local experts, we are seeing significant technological advancements in China. These developments are partly driven by necessity, in response to increasing restrictions from its global competitor, the United States. In addition to DeepSeek, platforms like TikTok and Temu have grown on Western consumers. They are leapfrogging the traditional internet platforms and driving convergence in social and e-commerce. Beyond these visible changes, there are numerous technological advancements that may not be immediately apparent to consumers. These include developments in robotics, electric vehicles, batteries, renewable energy such as solar and wind, and nuclear energy. The large domestic market, availability of low-cost and skilled engineers, access to capital, and affordable infrastructure have contributed to China's significant share in global manufacturing. China accounts for about ~33% of global manufacturing capacity, exceeding that of G7 countries combined. This percentage is expected to grow as Chinese companies make progress in new (and higher value) industries. Consequently, the economy can produce a wide range of products at very low cost at scale, except for high-end semiconductors (at present). 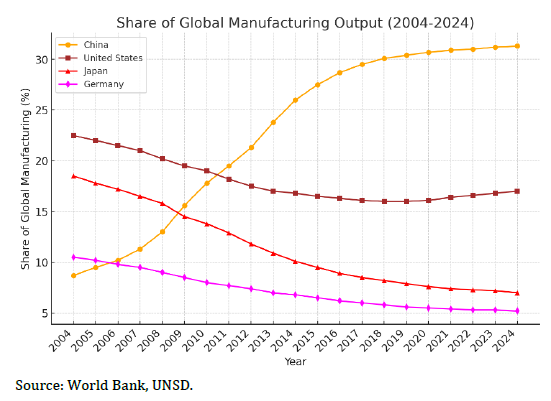
With its huge, educated work force, ample spare capacity, and large domestic market, entrepreneurs are afforded a runway to build great businesses. For instance, a hedge fund manager has managed to innovate and develop DeepSeek, a cost-effective AI solution. Similarly, several Chinese companies are poised to become significant players in robotics and are likely to be major suppliers of robotics components globally. Robotics may be the next high tech success story in China, following the footsteps of the domestic EV makers. The challenging transition in China was due to a realization by domestic authorities that the ever-expanding construction sector would eventually lead to negative consequences for the economy. Therefore, a shift towards quality and sophisticated products was deemed necessary. This transition is nearly complete, and the benefits of these efforts are expected to emerge as these new growth sectors begin to offset the decline in traditional industries such as property construction, which has experienced a significant reduction of approximately 70% from its peak. The re-orientation towards quality has resulted in local players gaining market share in almost all industrial and technological sectors domestically. This trend may extend to the rest of the world, depending on trade dynamics in the coming years. The cost and quality advantages of Chinese cars, batteries, robots, and AI are expected to be highly appealing globally. While some countries may choose to block BYD or DeepSeek, they will be stuck with gas guzzlers and expensive AI models while the rest of the world get to benefit from having stronger ties with China and its companies! At Ox Capital, we own a number of innovative businesses in China that we believe will become global champions. We firmly believe we own companies that are going to disrupt industries rather than those that will be disrupted. Given the negativity that is still prevalent on Chinese (particularly in Hong Kong) shares, the plethora of opportunities is too good to ignore! 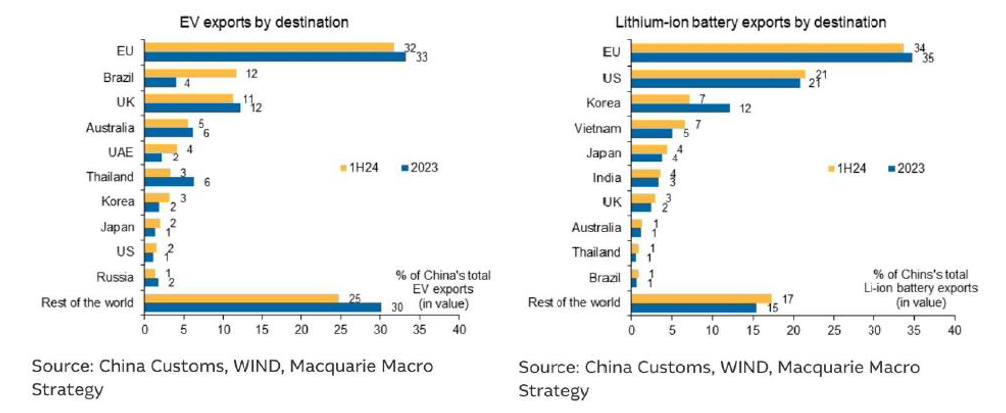 Funds operated by this manager: Ox Capital Dynamic Emerging Markets Fund Important Information: This material has been prepared by Ox Capital Management Pty Ltd (Ox Cap) (ABN 60 648 887 914) Ox Cap is the holder of an Australian financial services license AFSL 533828 and is regulated under the laws of Australia. This document does not relate to any financial or investment product or service and does not constitute or form part of any offer to sell, or any solicitation of any offer to subscribe or interests and the information provided is intended to be general in nature only. This should not form the basis of, or be relied upon for the purpose of, any investment decision. This document is not available to retail investors as defined under local laws. This document has been prepared without taking into account any person's objectives, financial situation or needs. Any person receiving the information in this document should consider the appropriaten |

27 Mar 2025 - Tim Hext: Three key takeaways from Australia's latest national accounts data
|
Tim Hext: Three key takeaways from Australia's latest national accounts data Pendal March 2025 |
|
IT'S been five years this week since the Covid chaos emerged. Aftershocks have kept rolling in since then. But is the Australian economy finally starting to look more "normal"? The latest set of Australian national accounts (see below) shows Gross Domestic Product growth at 0.6% for the December quarter, suggesting that conditions may, indeed, be moving closer to normal. Why is that? Below are three takeaways from the latest data. 
The consumer is finally emerging, albeit tentatively, as a positive impact on the economy. Household consumption grew by 0.4%, contributing 0.2% to the 0.6% overall GDP growth. The contribution had been near zero over the previous year. Consumers finally had positive real wages growth in 2024 (3.2% wage growth versus 2.5% inflation). Consumers also spent some of the Stage 3 tax cuts since July. We estimate that around 25% was spent and 75% saved, helping the savings rate to climb to 3.8% from below 3% a year ago.
Government consumption grew by 0.7% in Q4, driven largely by the states. This is at least moderating from near 1.5% growth a quarter earlier. Government investment also moderated but remains high at 1.8% over the quarter. Overall, the public sector contributed 0.2% to the 0.6% growth. The government needs to keep moderating spending and investment if the re-emerging consumer is to avoid causing inflationary pressures. In many areas of the economy, the private and public sectors compete for supply of labour, capital and goods.
Private investment rose only by 0.3% in the quarter. Business investment is showing some signs of life, but dwelling investment is falling -- not helped by high rates. There are, as always, different stories in different sectors. But the overall picture is productivity continuing to flat-line. GDP per hour worked fell again and is 1.2% lower over the year. The focus on Australia's poor productivity is becoming a bigger issue. Everyone has their reasons for it and different lobby groups will shift blame, promoting their own solutions (which normally involve government hand-outs). However, I did come across the graph below courtesy of Minack Advisors. 
Put simply, as our capital-to-labour ratio has fallen, so has labour productivity. Net investment to GDP is around the lows of the past 50 years against labour force growth at the highs (courtesy of immigration and participation). Overall, the latest today's national accounts report offers some hope of GDP moving back to the 2% to 2.5% the RBA is looking for. However, unless we can start improving productivity, we will be running to stand still. Author: Tim Hext |
|
Funds operated by this manager: Pendal Global Select Fund - Class R, Pendal Horizon Sustainable Australian Share Fund, Pendal MicroCap Opportunities Fund, Pendal Multi-Asset Target Return Fund, Pendal Sustainable Australian Fixed Interest Fund - Class R, Pendal Sustainable Australian Share Fund, Regnan Credit Impact Trust Fund, Regnan Global Equity Impact Solutions Fund - Class R |
|
This information has been prepared by Pendal Fund Services Limited (PFSL) ABN 13 161 249 332, AFSL No 431426 and is current as at December 8, 2021. PFSL is the responsible entity and issuer of units in the Pendal Multi-Asset Target Return Fund (Fund) ARSN: 623 987 968. A product disclosure statement (PDS) is available for the Fund and can be obtained by calling 1300 346 821 or visiting www.pendalgroup.com. The Target Market Determination (TMD) for the Fund is available at www.pendalgroup.com/ddo. You should obtain and consider the PDS and the TMD before deciding whether to acquire, continue to hold or dispose of units in the Fund. An investment in the Fund or any of the funds referred to in this web page is subject to investment risk, including possible delays in repayment of withdrawal proceeds and loss of income and principal invested. This information is for general purposes only, should not be considered as a comprehensive statement on any matter and should not be relied upon as such. It has been prepared without taking into account any recipient's personal objectives, financial situation or needs. Because of this, recipients should, before acting on this information, consider its appropriateness having regard to their individual objectives, financial situation and needs. This information is not to be regarded as a securities recommendation. The information may contain material provided by third parties, is given in good faith and has been derived from sources believed to be accurate as at its issue date. While such material is published with necessary permission, and while all reasonable care has been taken to ensure that the information is complete and correct, to the maximum extent permitted by law neither PFSL nor any company in the Pendal group accepts any responsibility or liability for the accuracy or completeness of this information. Performance figures are calculated in accordance with the Financial Services Council (FSC) standards. Performance data (post-fee) assumes reinvestment of distributions and is calculated using exit prices, net of management costs. Performance data (pre-fee) is calculated by adding back management costs to the post-fee performance. Past performance is not a reliable indicator of future performance. Any projections are predictive only and should not be relied upon when making an investment decision or recommendation. Whilst we have used every effort to ensure that the assumptions on which the projections are based are reasonable, the projections may be based on incorrect assumptions or may not take into account known or unknown risks and uncertainties. The actual results may differ materially from these projections. For more information, please call Customer Relations on 1300 346 821 8am to 6pm (Sydney time) or visit our website www.pendalgroup.com |

26 Mar 2025 - Trump's 'Period of Transition': Economic Reset or Market Risk?
|
Trump's 'Period of Transition': Economic Reset or Market Risk? JCB Jamieson Coote Bonds March 2025 Park your politics at the door, the changes that are occurring in the US, and thereby global markets - rightly or wrongly - are reshaping the financial market landscape at a frightening speed. Market uncertainty has surged following recent developments in US President Donald Trump's trade and economic policies. Investors hoping for US government support are likely to be bitterly disappointed by US Treasury Secretary Scott Bessent's remarks, as he dismissed the 10% equity selloff as "healthy" and "normal." Bessent further suggested that a market correction was necessary to prevent against euphoric markets, which he warned could trigger a financial crisis. He also cautioned that there were "no guarantees" that the US economy would not fall into a recession. These comments follow on from President Trump's comments last week, in which he asserted that the economy had to go through a "period of transition," arguing that previous growth had been "fake" under excessive government spending. This insistence ― that some 'short term pain for long term gain' has been sighted as the cause for weakness in equity markets. The Trump administration's efforts to slow the economy by cutting government spending and disrupting global relationships and trade agreements continue to unsettle investors. These developments have seen market and economic forecasters rapidly slashing their estimates for 2025, chopping any kind of positive outcomes from the suggested economic path. Status quo, or a weakening in the economy now seems to be the destination ahead if the current policy combinations remain in play - and potentially a significant weakening at that. This has been jolting for many market watchers who felt 2025 would be a constructive year under the business-friendly administration of Trump, especially given previous claims that the US economy was "exceptional." After a surge of optimism in post-election data, fuelled by expectations that tax cuts and deregulation would herald a new economic boom--sentiment has taken a sharp turn. Soft survey data has completely collapsed, taking the widely watched Atlanta Federal Reserve GDPNow tracker, a predictive tool which tries to read the health of the current economy in real time without the usual lags, to a scary -2.4% reading. This suggests the economy has hit stall speed and then some. Future outlook and investor cautionWe are yet to see such deterioration in the 'hard' data, but it does require close attention for investors, as the market will likely be punishing of anything suggestive that growth is slipping, such as falling retail sales or rising unemployment. While there is still a collective concern around the inflation outlook, especially as inflation expectations have risen, incoming inflation data shows signs of moderating, supported by declining oil prices and weaker demand for travel. However, falling growth indicators are likely to overtake inflation concerns in driving market sentiment. Historically, when growth falters, inflation is usually snubbed out very quickly due to demand destruction. Such a development would likely activate the US Federal Reserve (US Fed), which has remained in a holding pattern after last year's 100 basis point rates cuts - a non-stimulatory cutting cycle to match victories in fighting excessive inflation. The US Fed had moved to a "watch and see" holding pattern, keen to monitor the impact of Trump's policies on the economy. If economic conditions evolve with a material downside skew, a key question for markets will be how US Fed Chairman Jerome Powell responds to support the economy, particularly at a time when potential tariff-induced price rises could temporarily push inflation higher. This is a difficult policy combination, but the US Fed can potentially look through such a development, as many tariffs have yet to make a significant impact. In a "Trumpian" world, these tariffs might even fail to materialise just as quickly as they were enacted. The extent to which tariffs may drive inflation remains highly uncertain, providing Powell some wiggle room with US Fed policy. However, such look through is unlikely on the growth front. We have written at length on the feedback loops from stalling growth (remember the terminologies of 'hard', 'soft' or 'no' landing). If growth stalls it can be very difficult to reactivate without a 'stimulatory'' rate cutting cycle of significant magnitude. That is hardly a base case, but that outcome is growing in probability as the left tail of significantly higher rates is mitigated by the DOGE (Department of Government Efficiency - led by Elon Musk) effect on the economy. While risks remain, the prevailing sentiment suggests that authorities are prepared to act if markets experience deeper corrections. However, they are reluctant to overstep unless the situation becomes truly dire. Otherwise, further corrections remain "healthy". This is a colossal change worthy of your attention. As such, any notion of a Trump "put" seems further away for now. In other words, the idea of Trump stepping in to prop up markets in a crisis is less immediate than previously thought. In light of the uncertainties, particularly around the evolving economic landscape and potential policy shifts, investors need to be cautious and reassess their exposure to sectors vulnerable to policy changes, trade disruptions, and global economic slowdowns. While the US Fed's cautious stance offers some breathing room, the lack of definitive government support raises the likelihood of volatile market conditions ahead. Charlie Jamieson, Chief Investment Officer Funds operated by this manager: CC Jamieson Coote Bonds Active Bond Fund (Class A), CC Jamieson Coote Bonds Dynamic Alpha Fund, CC Jamieson Coote Bonds Global Bond Fund (Class A - Hedged) |

25 Mar 2025 - Manager Insights | Insync Fund Managers
|
Chris Gosselin, CEO of Australian Fund Monitors, speaks with Monik Kotecha Chief Investment Officer at Insync Fund Managers. Insync Fund Managers operate two funds, the Insync Global Capital Aware Fund (hedged) and the Insync Global Quality Equity Fund (unhedged). The two funds have the same strategy, the only difference being that one is hedged and the other is unhedged. The Insync Global Capital Aware Fund has a track record of 15 years and 5 months and has underperformed the All Countries World (AUD) benchmark since inception in October 2009, providing investors with an annualised return of 11.16% compared with the benchmark's return of 11.99% over the same period. At the same time, the Insync Global Quality Equity Fund has a track record of 15 years and 5 months and has outperformed the All Countries World (AUD) benchmark since inception in October 2009, providing investors with an annualised return of 13.06% compared with the benchmark's return of 11.99% over the same period.
|

25 Mar 2025 - Glenmore Asset Management - Market Commentary
|
Market Commentary - February Glenmore Asset Management March 2025 Globally, equity markets were weaker in February. In the US, the S&P 500 declined -1.4%, the Nasdaq fell -4.0%, whilst in the UK, the FTSE was bucked the trend, rising +1.6%. Domestically, the ASX All Ordinaries Accumulation index performed poorly, falling -4.0%. On the ASX, the top performing sectors were utilities and consumer staples, whilst technology and real estate underperformed. During the month, the Reserve Bank of Australia (RBA) cut interest rates by 25 basis points (bp), the first reduction in four years. Whilst the move was positive for equity markets, it was largely expected so had minimal impact in February. Comments for RBA Governor Michele Bullock that bond markets have been too bullish in their hopes with regards to the number of further rate cuts in 2025 had a significantly more negative impact on sentiment, though we continue to believe additional rate cuts will occur over the next 12-24 months. Bond yields declined modestly in February. The US 10-year government bond yield fell -6.6 basis points to close at 4.24%, whilst in Australia, the 10-year bond yield fell -13bp to close at 4.30%. Funds operated by this manager: |

24 Mar 2025 - Manager Insights | Seed Funds Management
|
Chris Gosselin, CEO of Australian Fund Monitors, speaks to Nicholas Chaplin, Director and Portfolio Manager at Seed Funds Management. The Seed Funds Management Hybrid Income Fund has a track record of 9 years and 5 months and has outperformed the Solactive Australian Hybrid Securities (Net) benchmark since inception in October 2015, providing investors with an annualised return of 6.46% compared with the benchmark's return of 4.83% over the same period.
|