A live webinar with ANZ's economics chief Adam Boyton and Pendal's head of bond strategies Tim Hext.
Find a Fund
Peer Group Analysis View All»
| Index Selector Links | 1 Year | 3 Year | 5 Year |
|---|---|---|---|
6.18% |
5.91% |
6.39% |
|
89.80% |
12.52% |
62.92% |
|
9.12% |
1.75% |
3.56% |
|
17.60% |
5.33% |
7.63% |
|
16.84% |
5.80% |
8.49% |
|
15.43% |
2.61% |
6.00% |
|
21.10% |
7.47% |
8.23% |
|
24.14% |
6.26% |
10.34% |
|
22.60% |
1.67% |
8.24% |
|
28.44% |
4.05% |
9.33% |
|
6.64% |
1.70% |
1.68% |
|
8.82% |
4.47% |
4.47% |
|
8.03% |
6.95% |
6.40% |
|
10.47% |
7.39% |
6.73% |
|
14.51% |
7.86% |
5.50% |
|
12.29% |
4.27% |
6.26% |
|
8.17% |
-2.70% |
1.02% |
Hedge Clippings

20 Dec 2024 - Hedge Clippings | 20 December 2024
|
|
|
|
Hedge Clippings | 20 December 2024 As we in Australia end the year as it started - with the RBA's cash rate stuck at 4.35% - in the US the FOMC cut rates 0.25% to 4.25 to 4.50%, leaving markets unimpressed - not so much because they were hoping for more, but because Jerome Powell flagged a slow down in the rate of cuts in 2025.
News & Insights Investment Perspectives: Why a Trump presidency could be deflationary | Quay Global Investors Proprietary Data - Strategic AI Advantage | Insync Fund Managers Market Commentary - November | Glenmore Asset Management November 2024 Performance News Glenmore Australian Equities Fund TAMIM Fund: Global High Conviction Unit Class Digital Income Fund (Digital Income Class) Equitable Investors Dragonfly Fund |
|
|
If you'd like to receive Hedge Clippings direct to your inbox each Friday |

15 Jan 2025 - Performance Report: 4D Global Infrastructure Fund (Unhedged)
[Current Manager Report if available]

15 Jan 2025 - Performance Report: Bennelong Australian Equities Fund
[Current Manager Report if available]

15 Jan 2025 - 10k Words | January 2025
|
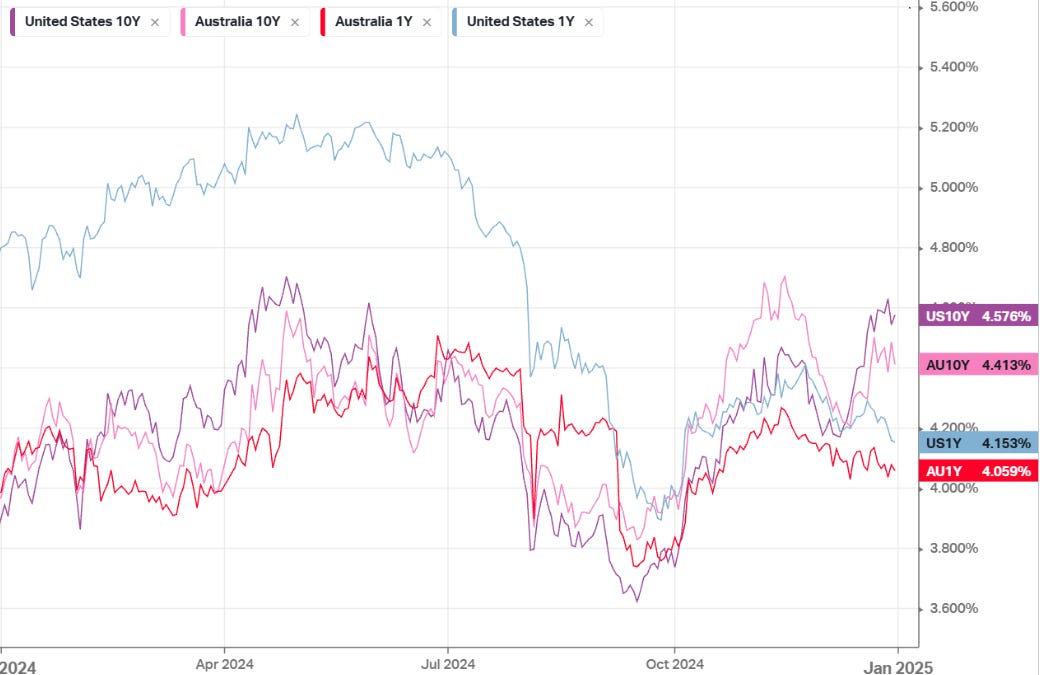
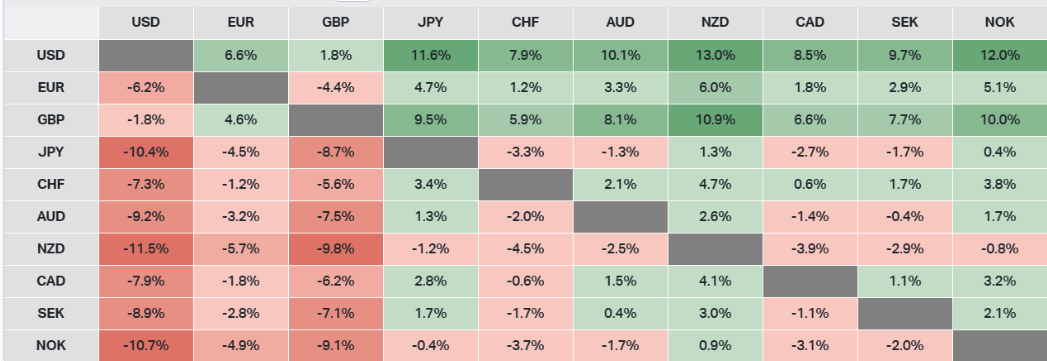
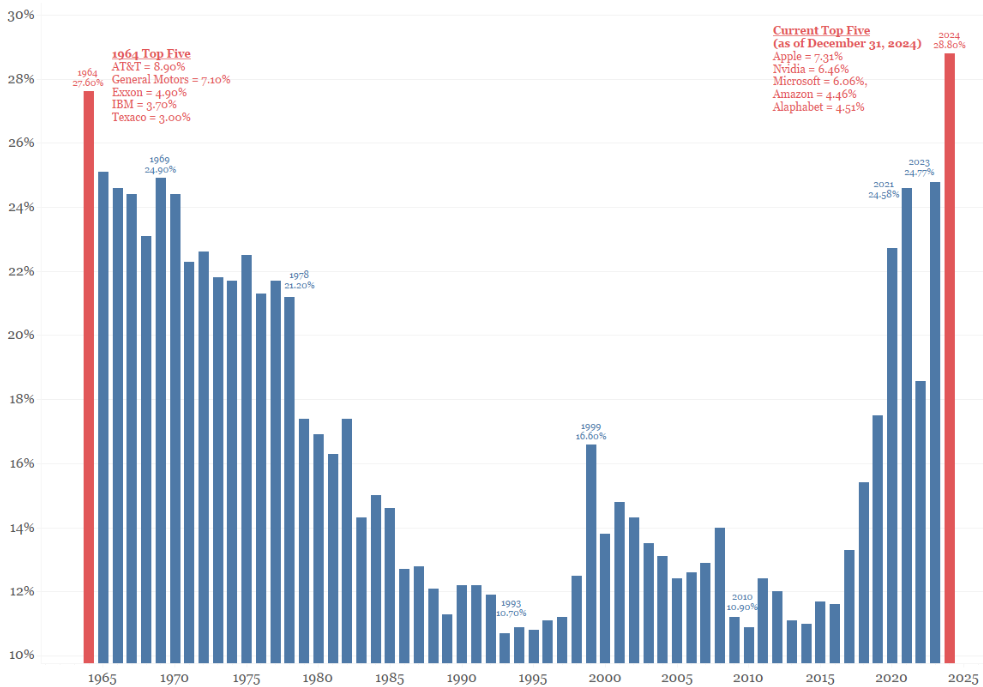
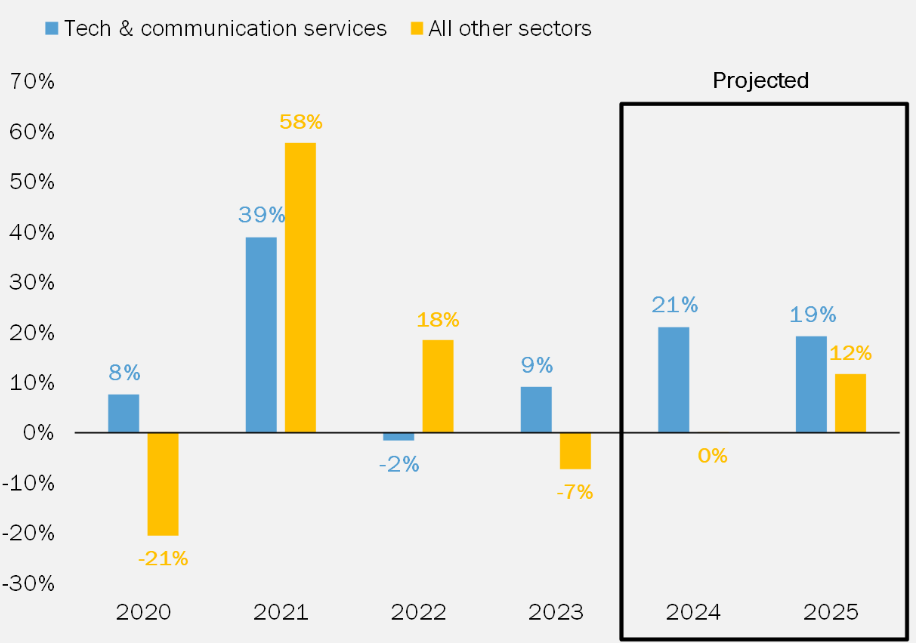
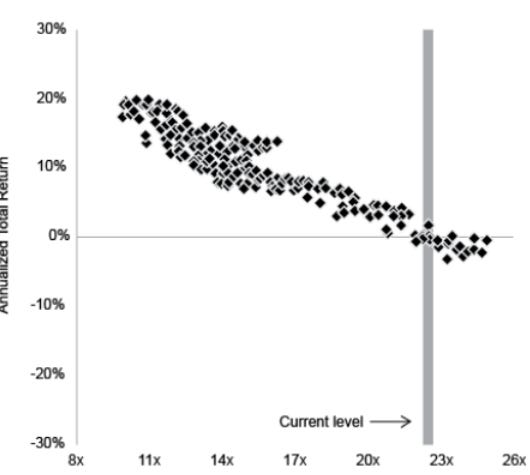
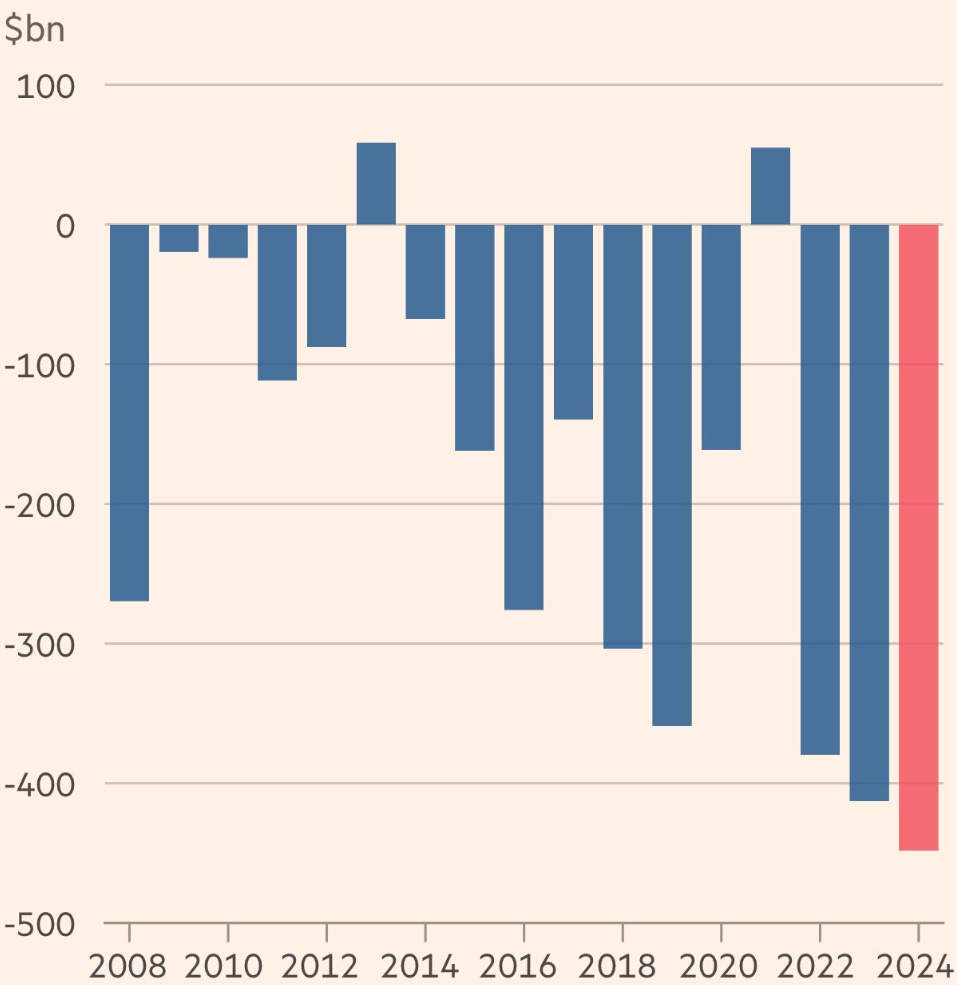
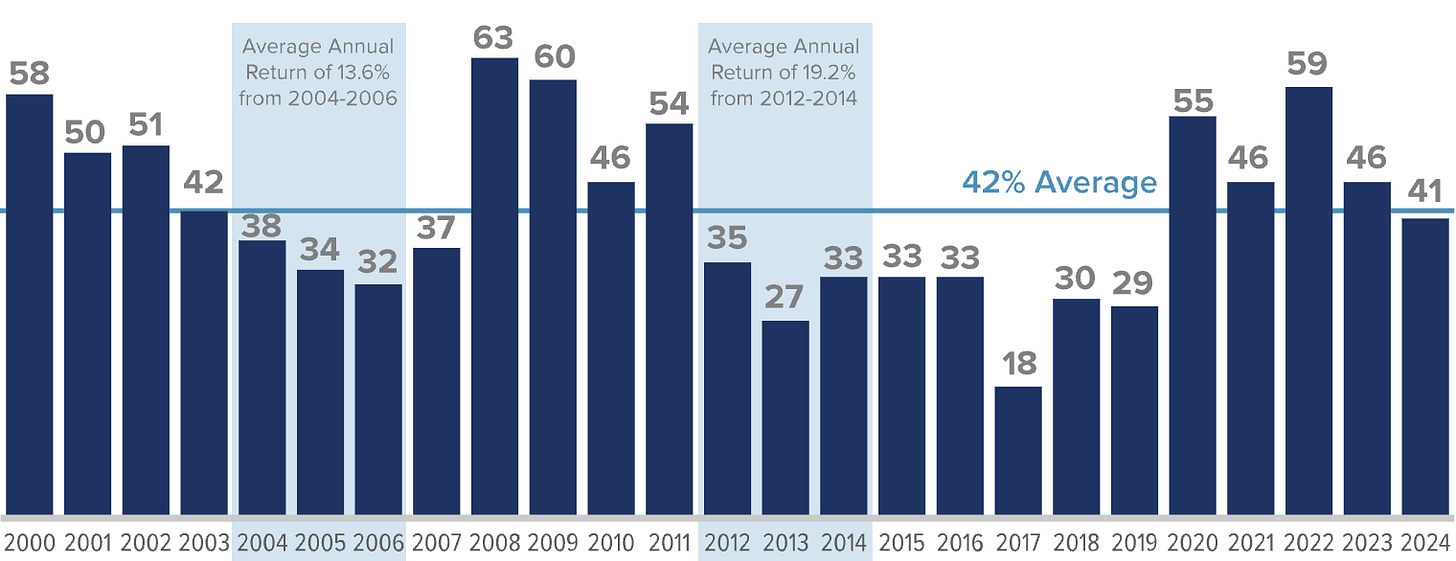
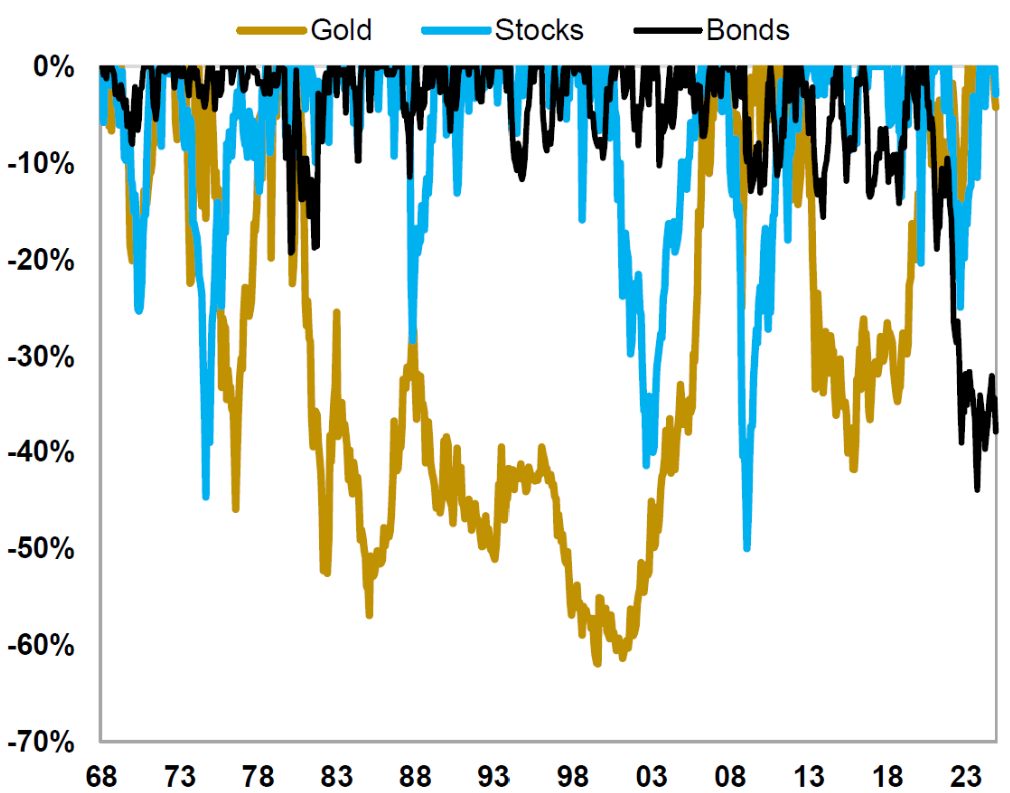
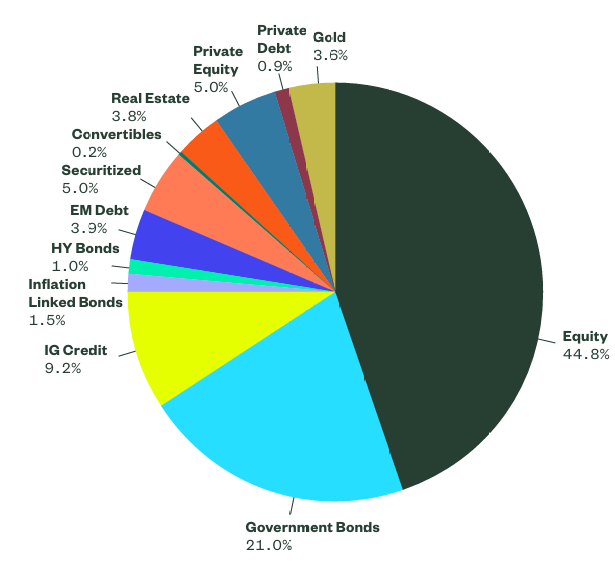
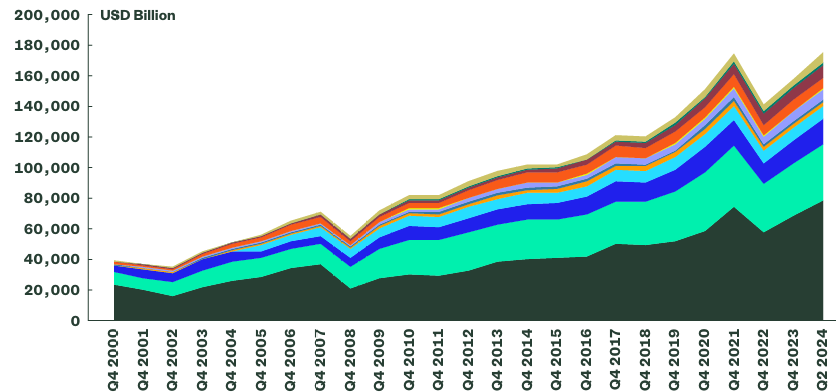
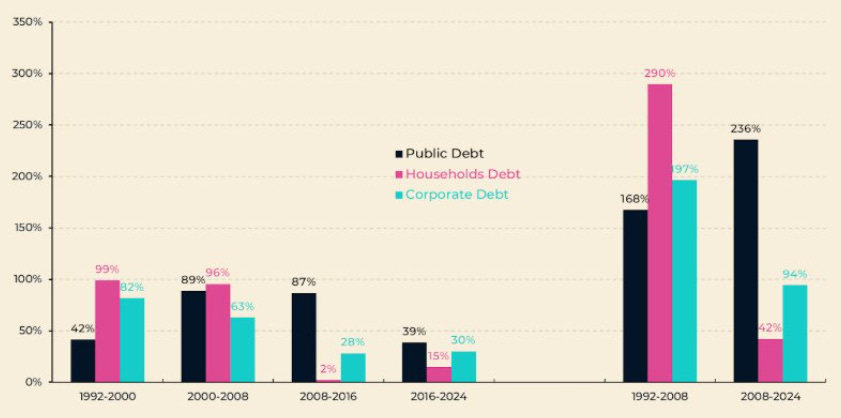
10k Words Equitable Investors January 2025 Only Argentina's sharemarket outpaced the US in CY2024, with a mediocre performance from Australia; 10-year bond yields expanded despite the Federal Reserve's rate cuts; the AUD battled while the USD went from strength-to-strength; while natural gas was the commodity of choice. We can't help but highlight the concentration in the US market once again; while its pricing is dependent on a resurgence in earnings outside the tech sector. The thing about high multiples for the S&P 500 is that they tend to be followed by low 10-year returns. Maybe that is why money flowed out of active equities funds in CY2024. We take a look at the implications of volatility on small cap returns and the severity of drawdowns that have been seen across asset classes through the decades. Then we see just how big a part of the global investment pie equities have become. Finally, we look at the increased role government borrowing has played in the US and government spending has played in Australia. Global equity ETF total returns for 2024 (in USD) Source: Koyfin, Equitable Investors Government bond yield movements in CY2024 Source: Koyfin, Equitable Investors Currency performance in CY2024 Source: Koyfin, Equitable Investors Commodities performance in CY2024 Source: Koyfin, Equitable Investors Share of total S&P 500 market cap held by 5 largest stocks Source: Bianco Research Year-on-year S&P 500 earnings growth - historical and projected Source: Callie Cox Media, Bloomberg S&P 500 forward P/E and subsequent 10-year returns Source: @thejoshviljoen Active equities fund outflows in 2024 Source: Financial Times Percentage of trading days with moves of 1% or more in the Russell 2000 over the last 25 years Source: Royce & Associates Drawdowns - the latest prices in relation to the previous all-time high Source: Topdown Charts Composition of the global market portfolio Source: State Street Global Advisors Evolution of the composition of the global market portfolio
Source: State Street Global Advisors US debt growth breakdown
Source: @TheKingCourt Data demand growth driving a surge in data centre power use
Source: @AvidCommentator January 2025 Edition Funds operated by this manager: Equitable Investors Dragonfly Fund Disclaimer Past performance is not a reliable indicator of future performance. Fund returns are quoted net of all fees, expenses and accrued performance fees. Delivery of this report to a recipient should not be relied on as a representation that there has been no change since the preparation date in the affairs or financial condition of the Fund or the Trustee; or that the information contained in this report remains accurate or complete at any time after the preparation date. Equitable Investors Pty Ltd (EI) does not guarantee or make any representation or warranty as to the accuracy or completeness of the information in this report. To the extent permitted by law, EI disclaims all liability that may otherwise arise due to any information in this report being inaccurate or information being omitted. This report does not take into account the particular investment objectives, financial situation and needs of potential investors. Before making a decision to invest in the Fund the recipient should obtain professional advice. This report does not purport to contain all the information that the recipient may require to evaluate a possible investment in the Fund. The recipient should conduct their own independent analysis of the Fund and refer to the current Information Memorandum, which is available from EI. |

14 Jan 2025 - The door for rate cuts opens further
|
The door for rate cuts opens further Pendal December 2024 |
|
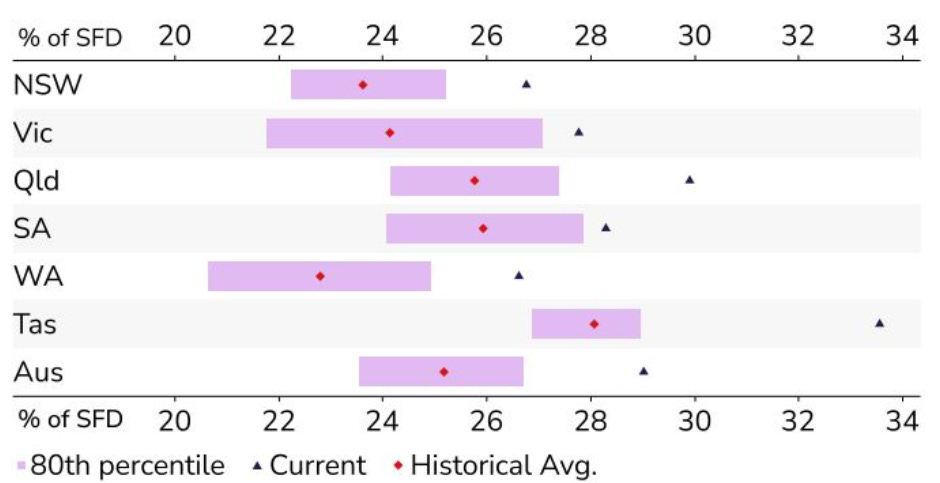
THE Australian economy grew by only 0.3% in the September quarter, once again falling behind population growth. We managed only 0.8% growth for the year, yet the RBA still thinks demand outstrips supply. The September quarter GDP numbers were always going to be more interesting than most. Tax cuts and government subsidies were hitting consumer pockets and the big question was whether they would be spent or saved. For now, it appears consumers have been happy to pocket the extra money. Spending by business and consumers once again flatlined and per capita consumption fell by 2% over the year. The only growth we could find was, once again, the government - which now comprises almost 28% of GDP, up from around 23% for most of the past 50 years. The graph below, courtesy of Westpac, highlights this extraordinary return of big government.  Source: Westpac Economics Source: Westpac Economics
Source: Wages grow 3.5 per cent for the year | Australian Bureau of Statistics The national accounts also provided more information around wage pressures. As the high wage outcomes of 2022 and 2023 have faded from view, these are easing quickly. Average earnings per hour moderated to 3.2%yr, from 6.5%yr in the June quarter. This is consistent with recent wage data at 3.5%. We have weak growth, moderating inflation, wages under control and global easing cycles - so why the hesitation from the RBA? The central bank remains focused on the idea that the labour market remains too tight, as it believes that 4.5% - not the current 4.1% - to be full employment. The data is now suggesting otherwise. OutlookIt will be an interesting few upcoming meetings for the RBA board. February will likely be the last monetary policy board decision for three of the six independent directors. And March or April will see a split into governance and monetary policy boards. Whether this influences thinking remains to be seen, but the current spirit of caution may yet stop a rate cut in February. However, I think the RBA may do a short sharp pivot in the next few months, and view two cuts (in February and May) as still on the cards. The Q4 inflation data at the end of February will be another low number, with even underlying inflation likely to print 0.6%, or annualised at the RBA midpoint. While bond investors will be cheering for a cut, the Labour government will be desperate for one ahead of the "cost-of-living" election. Time will tell if the RBA delivers for them. Author: Tim Hext |
|
Funds operated by this manager: Pendal Global Select Fund - Class R, Pendal Horizon Sustainable Australian Share Fund, Pendal MicroCap Opportunities Fund, Pendal Multi-Asset Target Return Fund, Pendal Sustainable Australian Fixed Interest Fund - Class R, Pendal Sustainable Australian Share Fund, Regnan Credit Impact Trust Fund, Regnan Global Equity Impact Solutions Fund - Class R |
|
This information has been prepared by Pendal Fund Services Limited (PFSL) ABN 13 161 249 332, AFSL No 431426 and is current as at December 8, 2021. PFSL is the responsible entity and issuer of units in the Pendal Multi-Asset Target Return Fund (Fund) ARSN: 623 987 968. A product disclosure statement (PDS) is available for the Fund and can be obtained by calling 1300 346 821 or visiting www.pendalgroup.com. The Target Market Determination (TMD) for the Fund is available at www.pendalgroup.com/ddo. You should obtain and consider the PDS and the TMD before deciding whether to acquire, continue to hold or dispose of units in the Fund. An investment in the Fund or any of the funds referred to in this web page is subject to investment risk, including possible delays in repayment of withdrawal proceeds and loss of income and principal invested. This information is for general purposes only, should not be considered as a comprehensive statement on any matter and should not be relied upon as such. It has been prepared without taking into account any recipient's personal objectives, financial situation or needs. Because of this, recipients should, before acting on this information, consider its appropriateness having regard to their individual objectives, financial situation and needs. This information is not to be regarded as a securities recommendation. The information may contain material provided by third parties, is given in good faith and has been derived from sources believed to be accurate as at its issue date. While such material is published with necessary permission, and while all reasonable care has been taken to ensure that the information is complete and correct, to the maximum extent permitted by law neither PFSL nor any company in the Pendal group accepts any responsibility or liability for the accuracy or completeness of this information. Performance figures are calculated in accordance with the Financial Services Council (FSC) standards. Performance data (post-fee) assumes reinvestment of distributions and is calculated using exit prices, net of management costs. Performance data (pre-fee) is calculated by adding back management costs to the post-fee performance. Past performance is not a reliable indicator of future performance. Any projections are predictive only and should not be relied upon when making an investment decision or recommendation. Whilst we have used every effort to ensure that the assumptions on which the projections are based are reasonable, the projections may be based on incorrect assumptions or may not take into account known or unknown risks and uncertainties. The actual results may differ materially from these projections. For more information, please call Customer Relations on 1300 346 821 8am to 6pm (Sydney time) or visit our website www.pendalgroup.com |

13 Jan 2025 - Understanding Bridging Loans: A Comprehensive Guide
|
Understanding Bridging Loans: A Comprehensive Guide Australian Secure Capital Fund December 2024 In the world of finance, the term "bridging loan" often comes up in conversations about short-term funding solutions. Bridging finance may seem complex, but understanding its key features can help clarify its benefits and risks. In this article, we'll explore what a bridging loan is, how it works, its advantages and disadvantages, and when it might be the right choice for you.
What is a Bridging Loan?A bridging loan is a type of short-term financing that is designed to "bridge" the gap between a financial need and a long-term financing solution. These loans are typically used when an individual or business needs to access funds quickly, often for a specific purpose, such as purchasing a new property before selling an existing one. Bridging loans are usually secured against an asset, often real estate, and can be arranged relatively quickly compared to traditional loans. Types of Bridging LoansThere are two main types of bridging loans: 1. Open Bridging Loans: These loans do not have a fixed repayment date, meaning they can be paid back at any time. They are usually used in situations where the borrower has not yet sold their existing property or is unsure when they will be able to repay the loan. 2. Closed Bridging Loans: These loans have a specific repayment date, typically aligned with the sale of a property. They are ideal for borrowers who have already exchanged contracts on a property and have a clear timeline for repayment. How Does Bridging Finance Work?Bridging finance operates on a straightforward premise: it provides quick access to funds that can be used for various purposes. The process generally involves the following steps: 1. Application: The borrower submits an application for a bridging loan, providing necessary documentation such as proof of income, details of the property being used as security, and information about the intended use of the funds. 2. Valuation: The lender will conduct a valuation of the property to ensure it is worth the amount being borrowed. This step is crucial, as the property serves as collateral for the loan. 3. Approval and Funding: If the application is approved, the lender will issue the funds, usually within a matter of days. This quick turnaround is one of the main advantages of bridging finance. 4. Repayment: The borrower will repay the loan either upon the completion of the intended project (e.g., selling a property) or on the agreed-upon repayment date for closed loans.
Advantages of Bridging LoansBridging loans come with several benefits that make them an attractive option for many borrowers: 1. Speed: One of the most significant advantages of bridging loans is their speed. Traditional loans can take weeks or even months to process, while bridging finance can be arranged in a matter of days. 2. Flexibility: Bridging loans offer flexibility in terms of repayment options. They can be tailored to fit the borrower's specific needs, whether it's a short-term loan for a few weeks or a few months. 3. Access to Funds: Bridging finance can provide access to funds that might not be available through traditional lending routes, especially for borrowers with less-than-perfect credit histories. 4. No Early Repayment Penalties: Many bridging loan providers do not impose penalties for early repayment (depending on the terms), which can be a crucial factor for borrowers looking to reduce their overall interest costs. Disadvantages of Bridging LoansWhile bridging loans offer many benefits, they also come with some drawbacks that should not be overlooked: 1. Higher Interest Rates: Bridging loans typically have higher interest rates compared to traditional mortgages. This is due to their short-term nature and perceived risk associated with bridging loans. Borrowers should compare options to find a product that fits their circumstances. 2. Fees: Borrowers may encounter various fees associated with bridging loans, including arrangement fees, valuation fees, and legal fees, which can add to the overall cost. 3. Risk of Repossession: Since bridging loans are secured against an asset, failure to repay can result in the lender repossessing the property used as collateral. 4. Short-Term Solution: Bridging loans are not meant to be a long-term financing solution. Borrowers need to have a clear plan for repayment, as these loans usually need to be settled within a few months. When to Consider a Bridging LoanBridging loans may be a suitable financial tool in specific situations, depending on your circumstances and the terms provided by the lender. Here are a few scenarios where bridging finance might make sense: 1. Property Transactions: If you are in the process of buying a new home but have not yet sold your current property, a bridging loan can provide the funds needed to make the purchase without the stress of timing the two transactions perfectly. 2. Investment Opportunities: Investors might use bridging loans to seize opportunities that require quick financing, such as auction purchases or real estate investments that need renovation before resale. 3. Business Funding: Businesses may need immediate capital for various reasons, such as purchasing new equipment or covering operational costs during a slow period. Bridging finance can provide that necessary cash flow. Bridging loans may offer a short-term financial solution for those who meet the lender's criteria and have a clear repayment strategy. While they come with higher interest rates and various fees, their speed and flexibility make them an attractive option for many borrowers. Whether you're looking to purchase a new home, invest in real estate, or fund a business need, understanding bridging finance can help you make informed decisions about your financial future. As with any financial product, it's essential to weigh the pros and cons carefully and consult with a financial advisor if needed. Bridging loans can be an excellent tool in your financial arsenal -- just ensure you know how to use them wisely. Author: Mikaela Gladden Funds operated by this manager: ASCF High Yield Fund, ASCF Premium Capital Fund, ASCF Select Income Fund The content on this page is intended solely for general informational and educational purposes and should not be interpreted as financial advice. Although we make every effort to ensure the accuracy and relevance of the information, it may not always reflect the latest legal or financial changes. We strongly recommend seeking guidance from a qualified financial advisor or professional before making any financial decisions. Use the information at your own discretion. |

20 Dec 2024 - Performance Report: Insync Global Quality Equity Fund
[Current Manager Report if available]

20 Dec 2024 - Performance Report: Insync Global Capital Aware Fund
[Current Manager Report if available]

20 Dec 2024 - Performance Report: PURE Resources Fund
[Current Manager Report if available]

20 Dec 2024 - Performance Report: PURE Income & Growth Fund
[Current Manager Report if available]

20 Dec 2024 - Performance Report: ECCM Systematic Trend Fund
[Current Manager Report if available]

11 Dec 2024 - "A is for Ambition": Apple and Amazon Bet Big on the Future
|
"A is for Ambition": Apple and Amazon Bet Big on the Future Alphinity Investment Management December 2024 |
|
The recent Apple and Amazon third quarter 2024 results revealed further details around the critical leg of their strategies, with these tech giants continuing to lay down markers for how they see the next stage of tech evolution unfolding and staking out positions to profit from it. Looming large in this evolution is AI, with Apple looking to leverage capabilities across what is an enormous ecosystem of 2.2bn active devices while Amazon is focusing on pushing AI applications across their Cloud and consumer business. The recent results also provided key insights into shorter term business performance.  Key takeaway from the result? The key takeaway from the Apple result is that while the gains from the release of "Apple Intelligence" will be significant, they will take time. This was evidenced by the fact that despite this recent result coming in ahead of expectations, it was coupled with a guide for the coming quarter that was mildly below what the market was looking for (Apple guided to revenue growth of low to mid-single digits vs a market that was expecting +7%). This makes sense as "Apple Intelligence" has only just rolled out in the US in recent weeks, and will not become available in the UK, Australia, Canada, and New Zealand until December 2024. Other geographies will follow over the course of 2025. Most importantly, it is also December 2024 before we see a meaningful expansion of the AI features including the long-awaited Chat GPT integration. As such, the powerful iPhone upgrade cycle that we expect to come with "Apple Intelligence" is likely to be a slow burn, with momentum building through 2025 and into 2026. What impressed? The ability of Apple to turn a benign demand environment into double digit EPS growth is impressive. Products growth has been tepid but the higher growth Services business, margin expansion and a buy-back continues to drive EPS growth above 10%. What disappointed? While we appreciate that Apple Intelligence will take time, the pace of the roll-out driving the weaker than expected outlook for 4Q (which is their biggest quarter of the year) was mildly disappointing. However, Apple tend to focus on quality rather than speed, so we do think that their ability to monetise AI across an installed base of 2.2bn active devices is a compelling, multi-year opportunity. Interesting chart? The next phase for Apple is all about an iPhone replacement cycle coupled with an expansion of associated Services revenue. The chart below shows what happened the last time a compelling technology shift occurred, with 5G driving a compression in this replacement cycle. Since the most recent trough in FY21, replacement cycles have shifted out by more than 12 months. A compression of this replacement cycle back towards 4yrs will drive circa 10% EPS upgrades.  What are the key risks? There are a few key risks facing Apple in the coming years. Key among these are:
In summary, Apple's ability to monetise their enormous consumer ecosystem is almost unrivalled. They will find a structure through which to monetise Ai, both through device sales but more importantly through an expansion of Ai related Services offerings. There is no company better placed to be the window into Ai for the average consumer.  Key takeaway from the result? Margins, margins, margins. Given the scale of the Amazon business, a mild shift in margin outcomes can drive enormous gains in operating income and EPS. Amazon spooked the market during their 2Q24 results which showed margins for their core retail business to be weaker than expected, which was blamed on everything from mix (lower priced "everyday essentials" in baskets) to building extra satellites for their broadband business. However, come the 3Q24 result last week, all was forgotten as Amazon blew those margin expectations (that they ironically had guided to themselves) out of the water. So, the question becomes, will this margin expansion continue? What impressed? The margin outcome in the core retail business was impressive, particularly in the international segment. Despite pressures from mix and what appears to be heightened competition from legacy retailers (eg Walmart) and Chinese players (Temu, Shein), Amazon generated solid topline growth and exceptional margins. The Amazon cloud business AWS also showed a continuing reacceleration driven in part by AI. A combination of the "law of large numbers" plus optimisations had driven compression in cloud growth rates across Amazon (AWS), Microsoft (Azure) and Google (GCP). However, the advent of AI has driven a reacceleration in cloud growth, which is impressive given the base of business is significantly larger. What disappointed? While it may seem unusual to have any source of disappointment in an exceptionally strong result, the variability of the margin outcomes compared to what management expected could indicate a lack of visibility. While a "miss vs expectations" is very happily received when it is an upside surprise, it does raise some concerns that perhaps next time the "surprise" could be the other way. Interesting chart? Given the scale of the retail business, a shift in margin expectations has a material impact on earnings. A circa 100bps improvement in Retail margins vs current expectations for CY25 would drive a 7% beat in Amazon operating income. 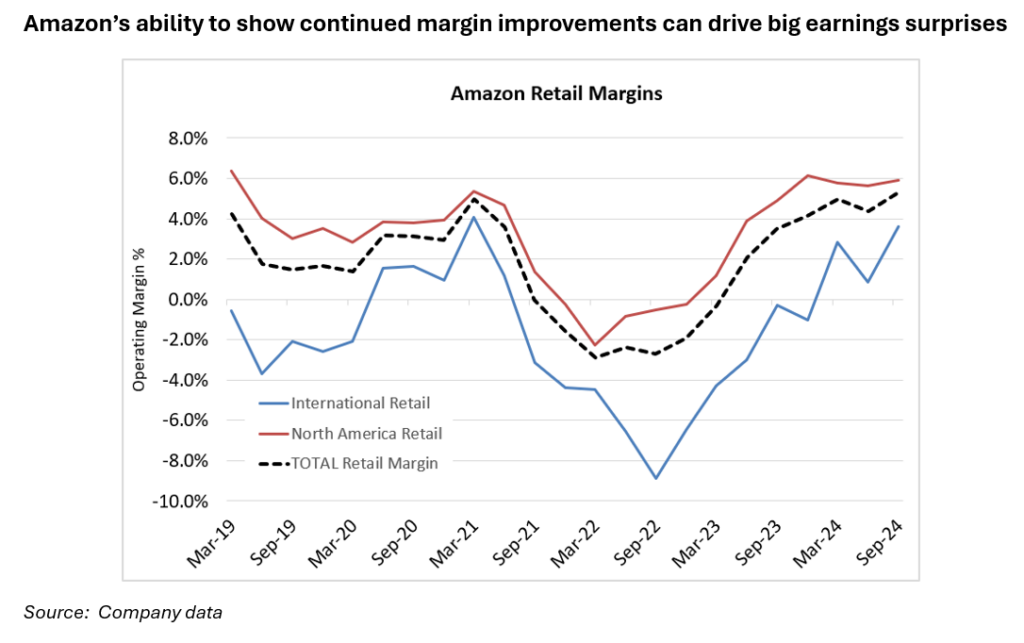 What are the key risks? For Amazon, risks are on a couple of key fronts:
In summary, Amazon's 3Q24 earnings report highlighted the significant earnings potential of the business and underscored the company's strong market position and attractive consumer offerings. However, it is crucial to closely monitor Amazon's ability to sustain margin improvements and effectively navigate ongoing consumer pressures in the future. |
|
Funds operated by this manager: Alphinity Australian Share Fund, Alphinity Concentrated Australian Share Fund, Alphinity Global Equity Fund, Alphinity Global Sustainable Equity Fund, Alphinity Sustainable Share Fund |

9 Dec 2024 - How Trump will impact equity markets
|
How Trump will impact equity markets Magellan Asset Management November 2024 |
|
The United States has spoken. President Trump will return to the White House in the new year. But how can we cut through the noise to reveal the investment, economic and geopolitical ramifications? Magellan's Head of Global Equities and Portfolio Manager, Arvid Streimann, has over 25 years' experience of following markets and politics, and over this time has built up a network of trusted contacts, he can offer a measured, independent view of the situation, including his expectations on Donald Trump's policy initiatives and decision making. He's joined by Investment Director Elisa Di Marco for an exploration of the implications of a Republican clean sweep, including the impact on standards of living and consumer sentiment, as well as the potential for deregulation, and President Trump's promise to adopt protectionist policies in an effort to develop self-sufficiency. They share insights into geopolitical dynamics, including U.S.-China relations, Iran and Ukraine, and discuss the risks and opportunities for investors. |
|
Funds operated by this manager: Important Information: Important Information: This material has been delivered to you by Magellan Asset Management Limited ABN 31 120 593 946 AFS Licence No. 304 301 ('Magellan') and has been prepared for general information purposes only and must not be construed as investment advice or as an investment recommendation. This material does not take into account your investment objectives, financial situation or particular needs. This material does not constitute an offer or inducement to engage in an investment activity nor does it form part of any offer documentation, offer or invitation to purchase, sell or subscribe for interests in any type of investment product or service. You should obtain and consider the relevant Product Disclosure Statement ('PDS') and Target Market Determination ('TMD') and consider obtaining professional investment advice tailored to your specific circumstances before making a decision about whether to acquire, or continue to hold, the relevant financial product. A copy of the relevant PDS and TMD relating to a Magellan financial product may be obtained by calling +61 2 9235 4888 or by visiting www.magellangroup.com.au. Past performance is not necessarily indicative of future results and no person guarantees the future performance of any financial product or service, the amount or timing of any return from it, that asset allocations will be met, that it will be able to implement its investment strategy or that its investment objectives will be achieved. This material may contain 'forward-looking statements'. Actual events or results or the actual performance of a Magellan financial product or service may differ materially from those reflected or contemplated in such forward-looking statements. This material may include data, research and other information from third party sources. Magellan makes no guarantee that such information is accurate, complete or timely and does not provide any warranties regarding results obtained from its use. This information is subject to change at any time and no person has any responsibility to update any of the information provided in this material. Statements contained in this material that are not historical facts are based on current expectations, estimates, projections, opinions and beliefs of Magellan. Such statements involve known and unknown risks, uncertainties and other factors, and undue reliance should not be placed thereon. No representation or warranty is made with respect to the accuracy or completeness of any of the information contained in this material. Magellan will not be responsible or liable for any losses arising from your use or reliance upon any part of the information contained in this material. Any third party trademarks contained herein are the property of their respective owners and Magellan claims no ownership in, nor any affiliation with, such trademarks. Any third party trademarks that appear in this material are used for information purposes and only to identify the company names or brands of their respective owners. No affiliation, sponsorship or endorsement should be inferred from the use of these trademarks. This material and the information contained within it may not be reproduced, or disclosed, in whole or in part, without the prior written consent of Magellan. |

5 Dec 2024 - Manager Insights | East Coast Capital Management (From rubber to oats )
|
Chris Gosselin, CEO of FundMonitors.com, speaks with Richard Brennan, Strategy Ambassador at East Coast Capital Management. The ECCM Systematic Trend Fund has a track record of 4 years and 10 months. The fund has outperformed the SG Trend benchmark since inception in January 2020, providing investors with an annualised return of 15.09% compared with the benchmark's return of 6.97% over the same period. Key to its success were high commodity market allocations and a systematic, risk-managed approach, offering strong diversification benefits with low correlation to traditional asset classes like the ASX 200.
|

20 Nov 2024 - Manager Insights | East Coast Capital Management (Trend friends and navigating uncertainty) )
|
Chris Gosselin, CEO of FundMonitors.com, speaks with Richard Brennan, Strategy Ambassador at East Coast Capital Management. The ECCM Systematic Trend Fund has a track record of 4 years and 10 months. The fund has outperformed the SG Trend benchmark since inception in January 2020, providing investors with an annualised return of 15.09% compared with the benchmark's return of 6.97% over the same period. Topics discussed include: the success of ECCM's trend-following strategy, which recently earned an award for the company's flagship fund; and how global diversification and a focus on trending opportunities can enable consistent performance even in uncertain economic conditions.
|

20 Nov 2024 - US Election 2024: How will markets and sectors respond?
|
US Election 2024: How will markets and sectors respond? Magellan Asset Management November 2024 |
|
Arvid Streimann offers an analysis of why Trump's victory was more decisive than predicted and the key issues that influenced voters' decisions. He provides insights into the market's reaction and shares his expectations for the next 12 months, highlighting which sectors are likely to perform better than others. |
|
Funds operated by this manager: Important Information: Important Information: This material has been delivered to you by Magellan Asset Management Limited ABN 31 120 593 946 AFS Licence No. 304 301 ('Magellan') and has been prepared for general information purposes only and must not be construed as investment advice or as an investment recommendation. This material does not take into account your investment objectives, financial situation or particular needs. This material does not constitute an offer or inducement to engage in an investment activity nor does it form part of any offer documentation, offer or invitation to purchase, sell or subscribe for interests in any type of investment product or service. You should obtain and consider the relevant Product Disclosure Statement ('PDS') and Target Market Determination ('TMD') and consider obtaining professional investment advice tailored to your specific circumstances before making a decision about whether to acquire, or continue to hold, the relevant financial product. A copy of the relevant PDS and TMD relating to a Magellan financial product may be obtained by calling +61 2 9235 4888 or by visiting www.magellangroup.com.au. Past performance is not necessarily indicative of future results and no person guarantees the future performance of any financial product or service, the amount or timing of any return from it, that asset allocations will be met, that it will be able to implement its investment strategy or that its investment objectives will be achieved. This material may contain 'forward-looking statements'. Actual events or results or the actual performance of a Magellan financial product or service may differ materially from those reflected or contemplated in such forward-looking statements. This material may include data, research and other information from third party sources. Magellan makes no guarantee that such information is accurate, complete or timely and does not provide any warranties regarding results obtained from its use. This information is subject to change at any time and no person has any responsibility to update any of the information provided in this material. Statements contained in this material that are not historical facts are based on current expectations, estimates, projections, opinions and beliefs of Magellan. Such statements involve known and unknown risks, uncertainties and other factors, and undue reliance should not be placed thereon. No representation or warranty is made with respect to the accuracy or completeness of any of the information contained in this material. Magellan will not be responsible or liable for any losses arising from your use or reliance upon any part of the information contained in this material. Any third party trademarks contained herein are the property of their respective owners and Magellan claims no ownership in, nor any affiliation with, such trademarks. Any third party trademarks that appear in this material are used for information purposes and only to identify the company names or brands of their respective owners. No affiliation, sponsorship or endorsement should be inferred from the use of these trademarks. This material and the information contained within it may not be reproduced, or disclosed, in whole or in part, without the prior written consent of Magellan. |

12 Nov 2024 - Megatrends for 2025 and beyond...

8 Nov 2024 - Artificial Intelligence will change the world (eventually)
|
Artificial Intelligence will change the world (eventually) Alphinity Investment Management October 2024
|
|
"The risk of underinvesting is dramatically greater than the risk of overinvesting" (Sundar Pichai, Alphabet CEO, 23rd July 2024). This quote from the Alphabet CEO during the Alphabet 2Q earnings call amplified investor concerns around the current Artificial Intelligence ("AI") investment landscape. The technology industry appears to be engaged in a high-stakes race to develop AI infrastructure, while the potential returns on these massive investments remain ambiguous. Given the substantial market share and valuation premiums now commanded by AI-focused companies, there's mounting pressure for these firms to demonstrate tangible returns on their AI investments. Investors are increasingly looking for concrete evidence that the massive capital inflows into AI infrastructure and development will translate into sustainable revenue streams and long-term profitability. Despite market impatience, we are observing encouraging signs of AI's impact starting to emerge from both the revenue and expense sides of businesses. Substantial returns will however take time to materialise. Given the current market dynamics, we remain nimble with our AI exposure in the short term, but unequivocally convinced on the longevity and scale of the AI opportunity over the long term. Where are the returns?Market concerns around overinvesting in AI are not without precedent given the technology sector's history of several technology boom-and-bust cycles: From the 1990's internet era exuberance leading to the dot.com crash, to the recent hype around the metaverse (virtual worlds), Web 3 (decentralised internet vision), and even non-fungible tokens (NFT's). These examples serve as cautionary tales, illustrating how technology hype can outpace real-world applications, leaving a trail of poor returns and crushed share prices in their wake. Current investment levels into AI architecture are extraordinary. Hyperscaler (Microsoft (NASDAQ: MSFT), META (NASDAQ: META), Alphabet (NASDAQ: GOOGL) & Amazon (NASDAQ: AMZN)) capex will rise more than 40% in CY24 and is expected to rise further in CY25 to levels 2.5x what they were in CY20. This level of investment is starting to have an impact on financial returns for these companies, both in terms of cash flow returns and on margins as higher depreciation flowing from this investment begins to bite in the P&L. Hyperscaler Capex ($bn) Returns take time to materialiseIn any major technological transition - be it internet, cloud computing, or the current wave of generative AI, there is a consistent pattern: infrastructure development precedes widespread application and the realisation of value. The internet evolution provides a compelling case study, where the true value from end applications and the resultant share price movements only started to emerge after 3 years and really gathered momentum after 5 years. Internet Cycle Stock Performance We can see a similar phenomenon play out with generative AI. Cloud AI services are beginning to inflect, as evidenced by recent results showing a reacceleration in cloud demand but several cutting-edge AI applications such as Edge AI, Smart Robots and Multi-Agent Systems are still in development and yet to reach widespread commercial deployment. Where are the end applications?Contrary to the notion that end applications of AI are not yet visible, we're witnessing a robust proliferation of AI-powered solutions across various sectors already emerging just ~20 months after the emergence of GEN AI. While these applications are in their initial phases and will take time to scale, their market potential is substantial. Take for example the M365 co-pilot example: a US$30 subscription fee per month across their 160m high value commercial users, could add $58bn revenue annually (a +23% lift to FY24 revenue). Expansion to the remaining 200m commercial users and integration into broader product offerings offer additional upside. Returns from "efficiencies"The impact of generative AI on business efficiency and productivity is emerging as a transformative force, with potential returns far exceeding initial revenue gains. This trend, while significant, remains underappreciated due to public concerns about AI-driven job displacement. However, real-world applications are already demonstrating substantial benefits across diverse industries. Companies are implementing AI with measurable success. For example:
Importantly, companies are beginning to qualify these benefits well beyond the bounds of tech:
The list goes on. The adoption of generative AI is rapidly expanding, with companies across various sectors reporting emerging and expanding use cases. How to quantify these returnsQuantifying the actual returns from generative AI can be a difficult exercise. For example, disaggregating how much of the Meta revenue acceleration comes from product enhancement due to Gen AI is complex, as is product augmentations flowing from its application to existing capabilities. Stepping back to a broader economic perspective, McKinsey undertook a study trying to piece together the incremental value that generative AI could bring. The total value was $6.1tr - $7.9tr annually across specific generative AI use cases and general productivity. Taking specific use cases, McKinsey's comprehensive analysis of generative AI applications provides a detailed roadmap of its potential impact across various business functions. McKinsey identified activities within business functions where generative AI could be applied and then calculated both the efficiency impact (as a % of functional spend) and the aggregate size of the opportunity. Remarkably, 75% of the generative AI impact was across a handful of functions spanning sales, marketing, product R&D, customer operations and software engineering, estimated to be a c$400-500bn impact across each function. Interestingly, we are beginning to get validation of some of these data points in our conversations with company management teams, for example in software engineering the efficiency/cost boost figure of c. 30% is now being discussed. Looking ahead, we will continue to monitor validation points of this return profile, but if this current trajectory of efficiency gains persists across various business functions, it suggests that the substantial investments in AI infrastructure are likely to be more than justified. |
|
Funds operated by this manager: Alphinity Australian Share Fund, Alphinity Concentrated Australian Share Fund, Alphinity Global Equity Fund, Alphinity Global Sustainable Equity Fund, Alphinity Sustainable Share Fund |

29 Oct 2024 - Magellan Global Quarterly Update
|
Magellan Global Quarterly Update Magellan Asset Management October 2024 |
|
Arvid Streimann, Nikki Thomas and Alan Pullen discuss key market themes and how the global strategy is positioned to capitalise on emerging opportunities, whilst monitoring the risks. Arvid also discusses the potential market impacts of the upcoming US election based on various possible outcomes. |
|
Funds operated by this manager: Magellan Global Fund (Hedged), Magellan Global Fund (Open Class Units) ASX:MGOC, Magellan High Conviction Fund, Magellan Infrastructure Fund, Magellan Infrastructure Fund (Unhedged), MFG Core Infrastructure Fund, Magellan Core ESG Fund Important Information: Important Information: This material has been delivered to you by Magellan Asset Management Limited ABN 31 120 593 946 AFS Licence No. 304 301 ('Magellan') and has been prepared for general information purposes only and must not be construed as investment advice or as an investment recommendation. This material does not take into account your investment objectives, financial situation or particular needs. This material does not constitute an offer or inducement to engage in an investment activity nor does it form part of any offer documentation, offer or invitation to purchase, sell or subscribe for interests in any type of investment product or service. You should obtain and consider the relevant Product Disclosure Statement ('PDS') and Target Market Determination ('TMD') and consider obtaining professional investment advice tailored to your specific circumstances before making a decision about whether to acquire, or continue to hold, the relevant financial product. A copy of the relevant PDS and TMD relating to a Magellan financial product may be obtained by calling +61 2 9235 4888 or by visiting www.magellangroup.com.au. Past performance is not necessarily indicative of future results and no person guarantees the future performance of any financial product or service, the amount or timing of any return from it, that asset allocations will be met, that it will be able to implement its investment strategy or that its investment objectives will be achieved. This material may contain 'forward-looking statements'. Actual events or results or the actual performance of a Magellan financial product or service may differ materially from those reflected or contemplated in such forward-looking statements. This material may include data, research and other information from third party sources. Magellan makes no guarantee that such information is accurate, complete or timely and does not provide any warranties regarding results obtained from its use. This information is subject to change at any time and no person has any responsibility to update any of the information provided in this material. Statements contained in this material that are not historical facts are based on current expectations, estimates, projections, opinions and beliefs of Magellan. Such statements involve known and unknown risks, uncertainties and other factors, and undue reliance should not be placed thereon. No representation or warranty is made with respect to the accuracy or completeness of any of the information contained in this material. Magellan will not be responsible or liable for any losses arising from your use or reliance upon any part of the information contained in this material. Any third party trademarks contained herein are the property of their respective owners and Magellan claims no ownership in, nor any affiliation with, such trademarks. Any third party trademarks that appear in this material are used for information purposes and only to identify the company names or brands of their respective owners. No affiliation, sponsorship or endorsement should be inferred from the use of these trademarks. This material and the information contained within it may not be reproduced, or disclosed, in whole or in part, without the prior written consent of Magellan. |

21 Oct 2024 - Manager Insights | Seed Funds Management
|
Chris Gosselin, CEO of Australian Fund Monitors, speaks to Nichols Chaplin, Director and Portfolio Manager at Seed Funds Management. Nicholas shares insights on APRA's plan to phase out additional tier one bonds, which could destabilise the banking sector and impact retail investors. The Seed Funds Management Hybrid Income Fund has a track record of 9 years and has outperformed the Solactive Australian Hybrid Securities (Net) benchmark since inception in October 2015, providing investors with an annualised return of 6.39% compared with the benchmark's return of 4.86% over the same period.
|

14 Oct 2024 - Manager Insights | Altor Capital
|
Chris Gosselin, CEO of FundMonitors.com, speaks with Benjamin Harrison, Chief Investment Officer at Altor Capital. The Altor AltFi Income Fund has a track record of 6 years and 5 months and has outperformed the RBA Cash Rate + 5% benchmark since inception in April 2018, providing investors with an annualised return of 11.68% compared with the benchmark's return of 6.67% over the same period.
Disclaimer This video presentation (the "Content") has been prepared by Australian Fund Monitors Pty Ltd, "AFM" (AFSL 324476) and has been prepared without taking into account the investment objectives of the viewer or recipient. The Content is intended for information purposes only, and recipients should conduct full research and take appropriate advice prior to making any investment decisions. The Content is believed to be accurate at the time of publication, but past performance is not guaranteed. Copyright, Australian Fund Monitors Pty Ltd. October 2024. |
Online Applicatons

Free, simple and secure
Olivia123 - the fast simple and secure online alternative to completing paper based application forms.


