

No events currently listed.
Find a Fund
Peer Group Analysis View All»
| Index Selector Links | 1 Year | 3 Year | 5 Year |
|---|---|---|---|
13.11% |
8.94% |
8.41% |
|
3.94% |
4.79% |
2.54% |
|
-17.81% |
19.33% |
6.15% |
|
7.15% |
7.37% |
2.40% |
|
10.94% |
7.63% |
6.05% |
|
22.58% |
12.46% |
9.16% |
|
6.18% |
10.38% |
6.62% |
|
18.67% |
12.22% |
4.89% |
|
5.61% |
6.85% |
6.32% |
|
12.88% |
13.46% |
8.29% |
|
8.85% |
8.32% |
4.17% |
|
21.32% |
15.17% |
7.09% |
|
13.68% |
10.37% |
10.19% |
|
10.93% |
8.05% |
5.65% |
|
7.03% |
8.32% |
7.11% |
|
-0.18% |
-0.64% |
1.23% |
|
8.56% |
8.92% |
7.82% |
Hedge Clippings

19 Aug 2022 - Hedge Clippings |19 August 2022
|
|
|
|
Hedge Clippings | Friday, 19 August 2022
This week in review: Scomo..... what was he thinking? Let's not go there... Neither in our view should further time and money be wasted on having an inquisition. It would seem nothing Scomo did was actually illegal, but the lack of transparency defies logic, and will define Scomo for ever. If nothing else, it at least shows the dangers of having a popularly elected President - if Donald hasn't already proven that. Moving onwards and upwards - hopefully in more ways than one... Markets bounced in July, with the ASX200 Accumulation Index rising 5.75%, after falling 8.77% in a horror June, while the S&P500 bounced 9.22% to make up for its June fall of 8.25%. Funds generally enjoyed the ride, with 80% of the funds on FundMonitors.com having reporting their July results, with those hit hardest in June enjoying the best of July. Having been on the nose in June (and if it comes to that for the past 6-8 months) growth stocks, and the funds investing in them, were the big winners, although in many cases they have a long way to catch up to their previous highs. There's no doubt there was some irrational selling, particularly in the small/mid cap space, as stretched valuations, gearing, year end tax selling etc., saw some companies trading close to or below cash backing. While we (and others) tend to focus on "performance" and top performing funds, there's a risk doing so at the expense of looking at risk and drawdowns. When the ASX200 fell 8.77% in June, 72% of equity based funds outperformed (i.e. fell less than the index). In July's market rally of 5.75%, only 40% of equity based funds managed to outperform the ASX200. Over the past few weeks we have been publishing our "Spotlight" series of articles exploring quantitative assessment of funds' returns to create a top performing portfolio. For those of you who have been following these articles, chasing top performing funds over the short term (say 1 year) is not the solution. The problem is that taking a longer term view (say 3-5 years) involves a variety of economic and market conditions, when funds with different styles, (for example growth or value) and strategies, perform very differently. In the past 3 years alone we've had 2 "bear" or negative equity markets. Extend that further, and the Global Equity Index benchmark (effectively the MSCI) was in negative territory on a cumulative basis from late 1999 through to the start of 2014 as shown by the chart below of Platinum's International Share Fund (blue) vs. the Global Equity Index (red), showing the effects of the dot com bubble of the late 1990s, the resultant "tech wreck" in 2000, and then the GFC in 2007-08. By comparison, the recent downturn (so far) puts things in perspective. There's a lesson in this for markets - a bubble always bursts, and the bigger or longer the bubble, the greater the burst. As for fund selection the lesson is equally clear: Protecting the downside through active risk management should, over time, result in good long-term performance. This week Hedge Clippings attended the Portfolio Construction Forum, as always expertly managed and MC'd by Graham Rich, with the addition of a variety of excellent speakers and panels covering (as one would expect) Portfolio Construction. The underlying theme over the two days was "The future ain't what it used to be". Given the above chart showing the variable market conditions experienced over the past 25 years, it's no surprise that asset allocation decisions (equities, bonds, alternatives, etc) are vital, but that requires a crystal ball. Having set asset allocations according to forward looking projections, the actual stock (or in our case fund) selection for a diversified portfolio is made based on backward looking history, namely the fund's track record. Nearly every advisor and fund manager we know (understandably) relies on past performance, but if "the future ain't what it used to be" is correct, it doesn't make fund selection, or portfolio construction, any easier! Of the many speakers at the forum, one of the most insightful was Marko Papic, Partner and Chief Strategist of the Clocktower Group in Santa Monica, who challenged the view often held in Australia that conflict over Taiwan was inevitable. His view (as my takeaway) was that the cost to China, and not just in economic terms, would far outweigh the strategic or geographic benefit of a military outcome. We hope he's correct, otherwise the future's not only not going to be what it was, but it's looking decidedly uncomfortable. News & Insights New Funds on FundMonitors.com 4D podcast: interest rates, inflation and infrastructure | 4D Infrastructure A look at the poster child for Owner-Managed | Airlie Funds Management Is the sky really falling in? | Insync Fund Managers |
|
|
July 2022 Performance News Digital Asset Fund (Digital Opportunities Class) Delft Partners Global High Conviction Strategy Glenmore Australian Equities Fund |
|
|
If you'd like to receive Hedge Clippings direct to your inbox each Friday
|

15 Nov 2022 - Magellan Global Strategy Update
|
Magellan Global Strategy Update Magellan Asset Management October 2022 |
|
Nikki Thomas, CFA, Portfolio Manager, discusses the market's reaction to the volatile macro environment, how Magellan's Global Portfolios are positioned and which quality companies are well placed to deliver growth in the years ahead. Speaker: Nikki Thomas, CFA, Portfolio Manager |
|
Funds operated by this manager: Magellan Global Fund (Hedged), Magellan Global Fund (Open Class Units) ASX:MGOC, Magellan High Conviction Fund, Magellan Infrastructure Fund, Magellan Infrastructure Fund (Unhedged), MFG Core Infrastructure Fund Important Information: This material has been delivered to you by Magellan Asset Management Limited ABN 31 120 593 946 AFS Licence No. 304 301 ('Magellan') and has been prepared for general information purposes only and must not be construed as investment advice or as an investment recommendation. This material does not take into account your investment objectives, financial situation or particular needs. This material does not constitute an offer or inducement to engage in an investment activity nor does it form part of any offer documentation, offer or invitation to purchase, sell or subscribe for interests in any type of investment product or service. You should read and consider any relevant offer documentation applicable to any investment product or service and consider obtaining professional investment advice tailored to your specific circumstances before making any investment decision. A copy of the relevant PDS relating to a Magellan financial product or service may be obtained by calling +61 2 9235 4888 or by visiting www.magellangroup.com.au. Past performance is not necessarily indicative of future results and no person guarantees the future performance of any strategy, the amount or timing of any return from it, that asset allocations will be met, that it will be able to be implemented and its investment strategy or that its investment objectives will be achieved. This material may contain 'forward-looking statements'. Actual events or results or the actual performance of a Magellan financial product or service may differ materially from those reflected or contemplated in such forward-looking statements. This material may include data, research and other information from third party sources. Magellan makes no guarantee that such information is accurate, complete or timely and does not provide any warranties regarding results obtained from its use. This information is subject to change at any time and no person has any responsibility to update any of the information provided in this material. Statements contained in this material that are not historical facts are based on current expectations, estimates, projections, opinions and beliefs of Magellan. Such statements involve known and unknown risks, uncertainties and other factors, and undue reliance should not be placed thereon. Any trademarks, logos, and service marks contained herein may be the registered and unregistered trademarks of their respective owners. This material and the information contained within it may not be reproduced, or disclosed, in whole or in part, without the prior written consent of Magellan. |

14 Nov 2022 - Performance Report: Insync Global Capital Aware Fund
| Report Date | |
| Manager | |
| Fund Name | |
| Strategy | |
| Latest Return Date | |
| Latest Return | |
| Latest 6 Months | |
| Latest 12 Months | |
| Latest 24 Months (pa) | |
| Annualised Since Inception | |
| Inception Date | |
| FUM (millions) | |
| Fund Overview | Insync invests in a concentrated portfolio of high quality companies that possess long 'runways' of future growth benefitting from Megatrends. Megatrends are multiyear structural and disruptive changes that transform the way we live our daily lives and result from a convergence of different underlying trends including innovation, politics, demographics, social attitudes and lifestyles. They provide important tailwinds to individual stocks and sectors, that reside within them. Insync believe this delivers exponential earnings growth ahead of market expectations. The fund uses Put Options to help buffer the depth and duration that sharp, severe negative market impacts would otherwide have on the value of the fund during these events. Insync screens the universe of 40,000 listed global companies to just 150 that it views as superior. This includes profitability, balance sheet performance, shareholder focus and valuations. 20-40 companies are then chosen for the portfolio. These reflect the best outcomes from further analysis using a proprietary DCF valuation, implied growth modelling, and free cash flow yield; alongside management, competitor, and industry scrutiny. The Fund may hold some cash (maximum of 5%), derivatives, currency contracts for hedging purposes, and American and/or Global Depository Receipts. It is however, for all intents and purposes, a 'long-only' fund, remaining fully invested irrespective of market cycles. |
| Manager Comments | The Insync Global Capital Aware Fund has a track record of 13 years and 1 month and has underperformed the Global Equity Index since inception in October 2009, providing investors with an annualised return of 9.52% compared with the index's return of 10.48% over the same period. On a calendar year basis, the fund has experienced a negative annual return on 2 occasions in the 13 years and 1 month since its inception. Over the past 12 months, the fund's largest drawdown was -29.45% vs the index's -15.77%, and since inception in October 2009 the fund's largest drawdown was -29.45% vs the index's maximum drawdown over the same period of -15.77%. The fund's maximum drawdown began in January 2022 and has so far lasted 9 months, reaching its lowest point during September 2022. The Manager has delivered these returns with 0.91% more volatility than the index, contributing to a Sharpe ratio which has fallen below 1 five times over the past five years and which currently sits at 0.67 since inception. The fund has provided positive monthly returns 81% of the time in rising markets and 21% of the time during periods of market decline, contributing to an up-capture ratio since inception of 59% and a down-capture ratio of 85%. |
| More Information |

14 Nov 2022 - Drawdowns and small stocks for God-like performance
|
Drawdowns and small stocks for God-like performance Equitable Investors October 2022 "If God is omnipotent, could he create a long-term active investment strategy fund that was so good that he could never get fired?," US-based quantitative investor and author Wesley Gray asked several years ago. Gray's data indicated that God would likely get fired - if God focused on picking investments that would deliver top decile (top 10%) returns over five years. After picking the stocks with perfect foresight and heading out fishing for five years, Gray found God's celestial clients would have endured drawdowns of as much as 76% in the interim. How many clients would have had the stomach to endure that? We semi-regularly take a look back at what the return distribution for ASX industrials has been like over a five year period. It is an exercise that provides data points and context when considering risk and return. We ran the numbers for the five years through to the end of August 2021, and found that:
Source: Equitable Investors, Sentieo Some of the names in the top decile are well known "growth" stocks like Hub24 (ASX: HUB) and Pro Medicus (ASX: PME). But there are plenty of names you may not have heard of - like IT recruitment and labour player HiTech Group (ASX: HIT) and medical diagnostic developer Proteomics (ASX: PIQ). For context, the annualised total returns for both the S&P/ASX 100 and the S&P/ASX Small Ordinaries benchmarks were both around 11% - substantially higher than the median stock in this review. The median stock would underperform indices over five years, if not for any other reason than simply because those indices would be rebalanced through the period in favour of the stocks that are performing. Consistent experienceThe distribution of returns in this period of review was similar to when we ran the same analysis back in May 2018, although in the latest numbers there is a slightly larger portion of stocks that have had negative outcomes (40% now versus 36% then). These figures are also consistent with a US analysis of the total lifetime returns for individual stocks between 1993 and 2006, where Blackstar Funds found 39% of all stocks had a negative return and around 20% were "significant" winners returning 300% or more. Source: Blackstar Funds InsightsKey insights we take out of the data presented here are that:
Author: Martin Pretty Funds operated by this manager: Equitable Investors Dragonfly Fund Disclaimer Nothing in this blog constitutes investment advice - or advice in any other field. Neither the information, commentary or any opinion contained in this blog constitutes a solicitation or offer by Equitable Investors Pty Ltd (Equitable Investors) or its affiliates to buy or sell any securities or other financial instruments. Nor shall any such security be offered or sold to any person in any jurisdiction in which such offer, solicitation, purchase, or sale would be unlawful under the securities laws of such jurisdiction. The content of this blog should not be relied upon in making investment decisions. Any decisions based on information contained on this blog are the sole responsibility of the visitor. In exchange for using this blog, the visitor agree to indemnify Equitable Investors and hold Equitable Investors, its officers, directors, employees, affiliates, agents, licensors and suppliers harmless against any and all claims, losses, liability, costs and expenses (including but not limited to legal fees) arising from your use of this blog, from your violation of these Terms or from any decisions that the visitor makes based on such information. This blog is for information purposes only and is not intended to be relied upon as a forecast, research or investment advice. The information on this blog does not constitute a recommendation, offer or solicitation to buy or sell any securities or to adopt any investment strategy. Although this material is based upon information that Equitable Investors considers reliable and endeavours to keep current, Equitable Investors does not assure that this material is accurate, current or complete, and it should not be relied upon as such. Any opinions expressed on this blog may change as subsequent conditions vary. Equitable Investors does not warrant, either expressly or implied, the accuracy or completeness of the information, text, graphics, links or other items contained on this blog and does not warrant that the functions contained in this blog will be uninterrupted or error-free, that defects will be corrected, or that the blog will be free of viruses or other harmful components. Equitable Investors expressly disclaims all liability for errors and omissions in the materials on this blog and for the use or interpretation by others of information contained on the blog |

11 Nov 2022 - Federal Budget October 2022-23 (For Adviser Only)

10 Nov 2022 - Performance Report: Skerryvore Global Emerging Markets All-Cap Equity Fund
| Report Date | |
| Manager | |
| Fund Name | |
| Strategy | |
| Latest Return Date | |
| Latest Return | |
| Latest 6 Months | |
| Latest 12 Months | |
| Latest 24 Months (pa) | |
| Annualised Since Inception | |
| Inception Date | |
| FUM (millions) | |
| Fund Overview | Emerging markets refers to countries that are transitioning from a low income, less developed economy towards a modern, industrial economy with a higher standard of living and greater connectivity to global markets. The strategy is index unaware (meaning that the Skerryvore team decides to invest in individual stocks based on their merit and without reference to the composition of the Benchmark) and the Fund's country and sector allocations will reflect the active bottom up investment approach of the Skerryvore team. The Fund also invests in companies that are incorporated and listed in developed market countries which have economic exposure to emerging markets. The difference in allocation against any emerging markets index can be significant. |
| Manager Comments | The Skerryvore Global Emerging Markets All-Cap Equity Fund has a track record of 1 year and 3 months and therefore comparison over all market conditions and against its peers is limited. However, the fund has underperformed the ASX 200 Total Return Index since inception in August 2021, providing investors with an annualised return of -9.5% compared with the index's return of -1.21% over the same period. Over the past 12 months, the fund's largest drawdown was -13.9% vs the index's -11.9%, and since inception in August 2021 the fund's largest drawdown was -17.45% vs the index's maximum drawdown over the same period of -11.9%. The fund's maximum drawdown began in September 2021 and has so far lasted 1 year and 1 month, reaching its lowest point during June 2022. The Manager has delivered these returns with 5.97% less volatility than the index. Since inception in August 2021 in the months where the market was negative, the fund has provided positive returns 38% of the time, contributing to a down-capture ratio since inception of 49.42%. For performance over the past 12 month, the fund's down-capture ratio is 19.68%. A down-capture ratio less than 100% indicates that, on average, the fund has outperformed in the market's negative months. |
| More Information |

10 Nov 2022 - Performance Report: 4D Global Infrastructure Fund (Unhedged)
| Report Date | |
| Manager | |
| Fund Name | |
| Strategy | |
| Latest Return Date | |
| Latest Return | |
| Latest 6 Months | |
| Latest 12 Months | |
| Latest 24 Months (pa) | |
| Annualised Since Inception | |
| Inception Date | |
| FUM (millions) | |
| Fund Overview | The fund is managed as a single portfolio including regulated utilities in gas, electricity and water, transport infrastructure such as airports, ports, road and rail, as well as communication assets such as the towers and satellite sectors. The portfolio is intended to have exposure to both developed and emerging market opportunities, with country risk assessed internally before any investment is considered. The maximum absolute position of an individual stock is 7% of the fund. |
| Manager Comments | The 4D Global Infrastructure Fund (Unhedged) has a track record of 6 years and 8 months and has underperformed the S&P Global Infrastructure TR (AUD) Index since inception in March 2016, providing investors with an annualised return of 8.24% compared with the index's return of 8.48% over the same period. On a calendar year basis, the fund has only experienced a negative annual return once in the 6 years and 8 months since its inception. Over the past 12 months, the fund's largest drawdown was -10.99% vs the index's -6.34%, and since inception in March 2016 the fund's largest drawdown was -19.77% vs the index's maximum drawdown over the same period of -24.67%. The fund's maximum drawdown began in February 2020 and lasted 2 years and 2 months, reaching its lowest point during September 2020. The fund had completely recovered its losses by April 2022. The Manager has delivered these returns with 0.26% less volatility than the index, contributing to a Sharpe ratio which has fallen below 1 five times over the past five years and which currently sits at 0.63 since inception. The fund has provided positive monthly returns 94% of the time in rising markets and 13% of the time during periods of market decline, contributing to an up-capture ratio since inception of 97% and a down-capture ratio of 99%. |
| More Information |

10 Nov 2022 - Inflation - higher for longer?
|
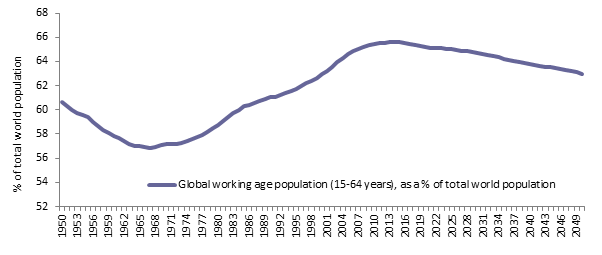
Inflation - higher for longer? abrdn October 2022 Inflation continues to be the dominant economic theme across the globe for governments, central banks and societies at large. The notion of this being a "transitory" phenomenon has been replaced by a realisation that it is much more persistent and far reaching than previously acknowledged. In turn, this has elicited aggressive tightening of monetary policy by central banks in an attempt to tame price pressures. Markets expect policymakers will be broadly successful in achieving this objective. Helpful in this respect are signs that a number of pandemic-related issues, such as supply-chain blockages and labour shortages, are beginning to ease. However, there are a variety of longer term, structural issues at play that should not be ignored as they have the potential to keep inflation elevated for a protracted period. This could further complicate the policy outlook, especially as the economic cycle looks increasingly mature. It's important to remember that the majority of these drivers were evident before policymakers rolled out Covid-induced stimulus packages. They may not be quashed by simply tightening financial conditions alone. It's therefore possible that inflation could become more ingrained globally, and while headline inflation rates may decline from their near-term highs, levels may stay elevated for longer. DeglobalisationA key facet of the mid-1980's 'Great Moderation' in inflation was increasing trade connectivity between countries and growing global interdependence. Ostensibly, developed economies benefited enormously from a liberation of the supply side. Technological advances, political reforms and economic stability allowed companies and governments to more cheaply access key inputs such as labour, raw materials and manufactured goods. In recent years, however, there's been a growing movement away from globalisation. Alarmed by China's increasing global clout, and spurred further by protectionist sentiments, the Trump administration began placing punitive tariffs on Chinese imports in 2018. President Biden has kept many of these tariffs in place. Similarly, political events such as the UK's decision to leave the EU and the embargos on Russian trade and investment are further evidence of the reversal of globalisation. At a corporate level, many firms have been moving towards shorter, more secure supply lines rather than simply the cheapest option. The pandemic exacerbated this trend. We're therefore seeing a reversal of the globalisation trend of recent decades that helped to keep input prices in check. Demographic driversInterlinked with the deglobalisation theme is the evolution of demographic factors, particularly when viewed through the prism of global supply of labour. In the late 1970s, we witnessed the beginning of an upward trend in the global working age population (those aged 15-64). This was led by the baby-boomers and medical advances. It also reflected the liberalisation of global labour markets and access to previously untapped sources of workers. The expanding supply of global labour contributed meaningfully to downward pressure on wages. However, as the chart below shows, this trend has started, and should continue to, reverse. This will potentially lead to a larger proportion of individuals who have little or no productive output but who still consume. In short, we have a situation of reduced labour supply that isn't matched by a material let up in demand. Global working age population (15-64 years), as a % of total world populationSource: UNCTAD e-handbook of Statistics 2021 Exacerbating this demographic trend has been a fall in labour participation rates in a number of developed market economies. There are various theories to explain this phenomenon. For example, large numbers of people unable to work due to 'long Covid,' early retirements and life preference changes. What matters from an inflation perspective is that reduced working age numbers, coupled with reduced participation rates, mean tighter labour markets and increased upward pressure on wages. Greenflation?An increasingly debated potential driver of structurally higher inflation is 'greenflation'. The movement towards a less carbon-intensive economy has been supported by tighter environmental regulations, as well as changing investor and corporate preferences. The result has been much reduced investment in traditional energy infrastructure in areas such as oil and gas. This is felt most acutely when exogenous strains are placed on fragile supply structures, as evidenced by the recent Ukraine conflict. More broadly, it seems unlikely that the transition towards a greener economy will be smooth. Many projects, by their very nature and scale, could take decades if not generations to execute. The implication for energy markets is that they are likely to remain volatile, with potentially increased upside risks to the inflation outlook. Putting everything togetherAlthough there will be regional and country variations, headline inflation in most developed markets appears likely to peak in late 2022 or early 2023. This will give some comfort to central bankers and government officials as it reduces the likelihood of a repeat of the early 1980s where more extreme policy measures were required to tackle excessive inflation. Still, we think inflation will remain a recurring and persistent theme, which will be a significant departure from the trend of the past four decades. With structural patterns apparently shifting, it is crucial that investors consider this evolution when constructing portfolios and recognise the value of real returns alongside nominal equivalents. Author: Adam Skerry, Head of Inflation Rate Management |
|
Funds operated by this manager: Aberdeen Standard Actively Hedged International Equities Fund, Aberdeen Standard Asian Opportunities Fund, Aberdeen Standard Australian Small Companies Fund, Aberdeen Standard Emerging Opportunities Fund, Aberdeen Standard Ex-20 Australian Equities Fund (Class A), Aberdeen Standard Focused Sustainable Australian Equity Fund, Aberdeen Standard Fully Hedged International Equities Fund, Aberdeen Standard Global Absolute Return Strategies Fund, Aberdeen Standard Global Corporate Bond Fund, Aberdeen Standard International Equity Fund , Aberdeen Standard Life Absolute Return Global Bond Strategies Fund, Aberdeen Standard Multi Asset Real Return Fund, Aberdeen Standard Multi-Asset Income Fund
|

9 Nov 2022 - Performance Report: Airlie Australian Share Fund
| Report Date | |
| Manager | |
| Fund Name | |
| Strategy | |
| Latest Return Date | |
| Latest Return | |
| Latest 6 Months | |
| Latest 12 Months | |
| Latest 24 Months (pa) | |
| Annualised Since Inception | |
| Inception Date | |
| FUM (millions) | |
| Fund Overview | The Fund is long-only with a bottom-up focus. It has a concentrated portfolio of 15-35 stocks (target 25). The fund has a maximum cash holding of 10% with an aim to be fully invested. Airlie employs a prudent investment approach that identifies companies based on their financial strength, attractive durable business characteristics and the quality of their management teams. Airlie invests in these companies when their view of their fair value exceeds the prevailing market price. It is jointly managed by Matt Williams and Emma Fisher. Matt has over 25 years' investment experience and formerly held the role of Head of Equities and Portfolio Manager at Perpetual Investments. Emma has over 8 years' investment experience and has previously worked as an investment analyst within the Australian equities team at Fidelity International and, prior to that, at Nomura Securities. |
| Manager Comments | The Airlie Australian Share Fund has a track record of 4 years and 5 months and therefore comparison over all market conditions and against its peers is limited. However, the fund has outperformed the ASX 200 Total Return Index since inception in June 2018, providing investors with an annualised return of 9.72% compared with the index's return of 7.09% over the same period. On a calendar year basis, the fund hasn't experienced any negative annual returns in the 4 years and 5 months since its inception. Over the past 12 months, the fund's largest drawdown was -16.29% vs the index's -11.9%, and since inception in June 2018 the fund's largest drawdown was -23.8% vs the index's maximum drawdown over the same period of -26.75%. The fund's maximum drawdown began in February 2020 and lasted 9 months, reaching its lowest point during March 2020. The fund had completely recovered its losses by November 2020. The Manager has delivered these returns with 0.01% less volatility than the index, contributing to a Sharpe ratio which has fallen below 1 three times over the past four years and which currently sits at 0.6 since inception. The fund has provided positive monthly returns 97% of the time in rising markets and 11% of the time during periods of market decline, contributing to an up-capture ratio since inception of 111% and a down-capture ratio of 97%. |
| More Information |
9 Nov 2022 - 4D inflation podcast (part 1): Paul Volcker, central banks, and the UK
|
4D inflation podcast (part 1): Paul Volcker, central banks, and the UK 4D Infrastructure October 2022 In part 1, Greg Goodsell (4D's Global Equity Strategist) speaks with Dave Whitby (Bennelong Account Director) about how most developed economies are dealing with inflation - and how the UK differs.
Speakers: Greg Goodsell, 4D's Global Equity Strategist and Dave Whitby, Bennelong Account Director |
|
Funds operated by this manager: 4D Global Infrastructure Fund, 4D Emerging Markets Infrastructure FundThe content contained in this audio represents the opinions of the speakers. The speakers may hold either long or short positions in securities of various companies discussed in the audio. This commentary in no way constitutes a solicitation of business or investment advice. It is intended solely as an avenue for the speakers to express their personal views on investing and for the entertainment of the listener. |

8 Nov 2022 - Performance Report: Quay Global Real Estate Fund (Unhedged)
| Report Date | |
| Manager | |
| Fund Name | |
| Strategy | |
| Latest Return Date | |
| Latest Return | |
| Latest 6 Months | |
| Latest 12 Months | |
| Latest 24 Months (pa) | |
| Annualised Since Inception | |
| Inception Date | |
| FUM (millions) | |
| Fund Overview | The Fund will invest in a number of global listed real estate companies, groups or funds. The investment strategy is to make investments in real estate securities at a price that will deliver a real, after inflation, total return of 5% per annum (before costs and fees), inclusive of distributions over a longer-term period. The Investment Strategy is indifferent to the constraints of any index benchmarks and is relatively concentrated in its number of investments. The Fund is expected to own between 20 and 40 securities, and from time to time up to 20% of the portfolio maybe invested in cash. The Fund is $A un-hedged. |
| Manager Comments | The Quay Global Real Estate Fund (Unhedged) has a track record of 6 years and 10 months and has outperformed the BBAREIT Index since inception in January 2016, providing investors with an annualised return of 6.07% compared with the index's return of 5.09% over the same period. On a calendar year basis, the fund has only experienced a negative annual return once in the 6 years and 10 months since its inception. Over the past 12 months, the fund's largest drawdown was -22.45% vs the index's -12.93%, and since inception in January 2016 the fund's largest drawdown was -22.45% vs the index's maximum drawdown over the same period of -23.56%. The fund's maximum drawdown began in January 2022 and has so far lasted 9 months, reaching its lowest point during September 2022. During this period, the index's maximum drawdown was -22.94%. The Manager has delivered these returns with 1.53% more volatility than the index, contributing to a Sharpe ratio for performance over the past 12 months of -0.85 and for performance since inception of 0.45. The fund has provided positive monthly returns 72% of the time in rising markets and 34% of the time during periods of market decline, contributing to an up-capture ratio since inception of 68% and a down-capture ratio of 72%. |
| More Information |
Online Applicatons

Free, simple and secure
Olivia123 - the fast simple and secure online alternative to completing paper based application forms.